Our 2017 annual report analysing trends and highlighting risks in electrical and gas accidents.
Download:
1. Executive Summary
Overview of 2017
During 2017 a total of 23 notifiable accidents and 24 non-notifiable gas and electricity accidents were reported to WorkSafe Energy Safety (ES) comprising of:
- One notifiable non-fire electrical accident, which didn’t cause a fatality but one person was injured.
- Three notifiable and ten non-notifiable natural gas accidents, none of which resulted in fatalities or injuries.
- 12 notifiable and 14 non-notifiable LPG accidents, which altogether resulted in no fatalities but caused injury to 11 people.
High-Risk Areas 1993-2017
Electrical and gas (natural and LPG) accident information from the last 25 years (1993-2017) has been categorised into relevant groups before being analysed for trends, frequency, and common causes. The information has also been also analysed for the severity and frequency of total accident occurrences for each of these groups.
Electrical accidents
The previously known general public accidents (1993-2008) and all public electrical accidents investigated since 2009 by Energy Safety are aggregated as a single electrical accident category to enable analysis.
Two categories of particular interest for WorkSafe Energy Safety are accidents involving young people and electrical safety in domestic residential environments.
- Young people (aged 17 years and less)
- In the last 25 years, young people were involved in 36% of general public accidents (289), of which there were 17 fatalities and 96 injuries.
- Domestic environment
- Over half (52%) of accidents involving the general public in the last 25 years occurred in domestic environments. There were 28 (58% of total) fatalities and 124 (48% of total) people injured from accidents in domestic environments.
Natural gas accidents
Equipment
- Cookers and ovens
- 18% of the notifiable accidents involved cookers or ovens. 12 of the 37 notifiable accidents resulted in one fatality and injury to 14 people.
- Cookers and ovens accounted for 11% of reported non-notifiable accidents.
- Space heaters
- 27% of the notifiable accidents involved space heaters. 14 of the 56 notifiable space heater accidents resulted in three fatalities and injury to 13 people.
- Space heaters accounted for 20% of reported non-notifiable accidents.
- Water heaters and boilers
- 34% of the notifiable accidents involved water heaters or boilers. 15 of the 69 notifiable water heater and boiler accidents resulted in one fatality and injury to 18 people.
- Water heaters and boilers also accounted for 5% of reported non-notifiable accidents.
Liquefied petroleum gas (LPG)
- Equipment Cookers and ovens
- 29% (122) of the 424 notifiable LPG accidents involved cookers or ovens. 87 of the 122 notifiable accidents involving cookers and ovens resulted in 17 fatalities and injury to 116 people.
- Cookers and ovens accounted for 16% of reported non-notifiable LPG accidents.
- Cabinet heaters
- 34% (143) of the notifiable LPG accidents involved cabinet heaters. 66 of the 143 notifiable cabinet heater accidents resulted in 13 fatalities and injury to 67 people.
- Cabinet heaters accounted for 30% of reported non-notifiable accidents.
- Containers (Refillable)
- 7% (30) of the notifiable accidents involved LPG refillable containers. 16 of the 26 notifiable container accidents caused four fatalities and injury to 19 people.
- Refillable containers accounted for 17% (91) of reported non-notifiable accidents.
Environment
- Caravans and campervans
- 11% (46) of the 424 notifiable LPG accidents occurred in caravans or campervans. 33 of the 46 notifiable accidents in caravans or campervans caused 11 fatalities and injury to 39 people.
2. Background
Energy Safety is part of WorkSafe New Zealand and is responsible for the administration of electricity and gas safety and related matters under the Gas Act 1992 and the Electricity Act 1992. Our aim is to bring a clear focus to safety, supply quality and measurement across the electricity and gas sectors.
In January 2009, responsibility for the investigation and reporting of worker and workplace accidents in the electricity and gas sectors, transferred from Energy Safety (ES) to the Labour Group (formerly The Department of Labour and now WorkSafe New Zealand).
At that time, the Labour Group assumed responsibility as lead agency for investigating and reporting on all workplace related gas and electrical accidents. Energy Safety remains the lead agency responsible for the investigation and reporting of non-workplace accidents involving members of the public and consumers.
WorkSafe and Energy Safety maintain an arrangement by which accidents notified to one agency is, where relevant, relayed to the other.
In 2013 Energy Safety became part of WorkSafe New Zealand with the same previous function and responsibility.
To maintain assurance of the safe supply and use of gas and electricity, Energy Safety conducts a range of functions under energy-related legislation. These include monitoring and enforcement, investigation of accidents, development and the promulgation of safety standards and information.
Energy Safety has published annual summaries of notifiable accidents since 2001, covering a period from 1998. The summaries provided regulatory agencies and industry participants with access to standardised summary accident information, and an analysis that highlights trends and risks. While the focus of the annual analyses has been on notifiable accidents, trends in non-notifiable accidents have also been examined.
Energy Safety replaced the annual summaries with quarterly publications at the beginning of 2009 to provide this information on a more frequent basis. The quarterly publications cover the notifiable accident investigations completed in that quarter.
The annual analyses complement the quarterly accident summaries. It examines accident data and trends related to accidents that occurred in that year.
3. Accident data collection and recording
Certain accidents have to be notified to Energy Safety1. These are generally high consequence accidents. This obligation falls on participants in the energy industry in the first instance. Notifications of gas and electricity related accidents also come from consumers and other agencies, such as the Fire and Emergency New Zealand (FENZ) or through WorkSafe New Zealand, or local body Health and Safety Inspectors.
WorkSafe Energy Safety investigates accidents in line with its responsibilities, and records at least a basic set of data on all reported accidents, regardless of the scale of the investigation. In general, more comprehensive information is recorded for the more intensive investigations that follow significant accidents.
Because there is no obligation, and no rationale that is consistently applied for industry or industry sectors to report non-notifiable accidents to WorkSafe Energy Safety, a low proportion of these accidents are reported. There have been instances where an organisation has, for a limited period, reported all accidents to WorkSafe Energy Safety that have come to its attention. This ‘bulk-reported’ data has been removed for analysis, particularly trend analysis.
WorkSafe Energy Safety does not, in general, conduct in depth investigations of electrically-caused fires unless there is evidence of equipment failure. This is because a significant number of fires that are related to the supply or use of electricity are either not reported or are not reported in a timely manner that allows for a meaningful investigation to be completed. In any case, many electrical fires, although covered by the Electricity Act, occur from incorrect operation or misuse of electrical equipment.
The definitions of “accident” are similar in the Electricity Act and the Gas Act. However there are significant differences in the collection and recording of electrical and gas accident data that affect the analysis of accidents and trends:
- Electrically-related fires are not included for analysis. As outlined above, there is evidence that there has historically been under-reporting to Energy Safety of less significant electrically-related fires. In addition our focus has been on electrical accidents2 other than fire.
- Energy Safety investigates and records gas-related accidents that involve fire, explosion, or gas ‘poisoning’3. Only those accidents that involve deliberate inhalation of LPG are excluded from analysis.
- The electrical accident database in use up until 2008 allowed investigators to record only one likely major cause for an electrical accident. The database used for gas investigations allowed investigators to record up to four likely causes or factors for a gas-related accident. The accident investigation database that has been in use since the beginning of 2008 allows a range of factors to be considered and identified.
Natural gas and liquefied petroleum gas (LPG) have different characteristics as fuels and differing distribution and utilisation patterns so they are recorded and analysed separately.
The gas accident database contains information about fatalities, injuries, fires, explosions and minor accidents for natural gas and LPG. These accidents have been analysed for severity4 and frequency of similar types of accidents.
Accident analysis
To identify trends and risk areas, this analysis examines data collected since 1993 on notifiable electrical accidents other than fires and both notifiable and non-notifiable gas accidents.
Since the implementation of the Electricity Act and the Gas Act came into force, comparisons have been made between five year periods.
This analysis includes the latest information available at the time of preparation. In some cases, the investigations are complex and may not have been completed at the time of publication. This means that each annual analysis has to review previous years’ cases when further information has been obtained.
This accident analysis does not set out to explain the reasons behind the trends and variations found. These trends may be influenced by any number of factors, including changes in the way accidents are reported, reporting level, or actual improvements in safety or safety practices.
Establishing the reason behind these trends would require detailed analysis of comprehensive data that is not always available and some of which may or may not exist.
WorkSafe Energy Safety uses a system called Energy Safety Intelligence (ESI), which was introduced at the beginning of 2008. This system integrates case management of electricity and gas operational activities, and stores electricity and gas accident information in a single database. This system has more data fields and a more consistent classification facility than was previously used. However, its introduction meant there were some unavoidable inconsistencies between data held on the new system and the data held on the previous systems. This, in turn, places constraints on the analysis.
4. Electrical accidents
This section deals with notifiable non-fire electrical accidents affecting members of the public which were reported to Energy Safety. In a typical non-fire electrical accident the victim receives an electric shock which requires medical treatment. In general these accidents are due to contact with, or coming into proximity with live electric lines, equipment or components. Fire-related electrical accidents and accidents that involve workers are not included in this analysis.
Electrical accidents prior to 1 January 2009 (when the Department of Labour, as it was at the time, assumed responsibility for investigating workplace accidents) were categorised under three main occupational headings: electrical workers, workers in other (non-electrical) occupations, and the general public. Generally about 50% of accidents involved electrical workers, 30% involved workers in other occupations, and 20% involved members of the public.
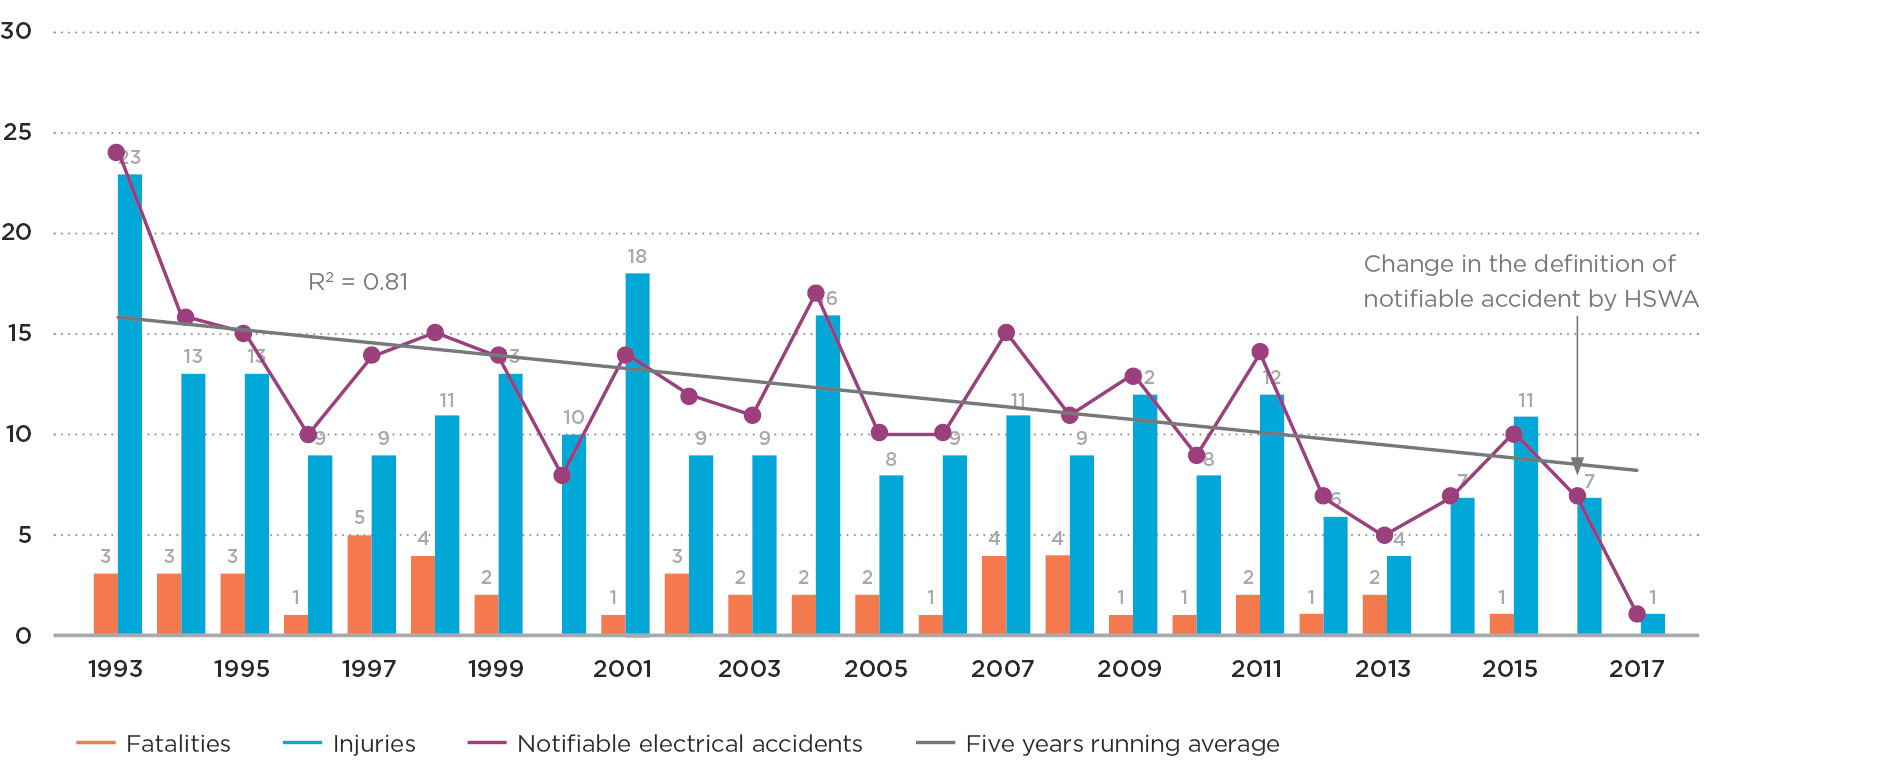
The definition of notifiable electrical accident of the Electricity Act is modified by the Health and Safety at Workplace Act in 20165. The threshold for the electrical notifiable accident is raised so now less number of electrical accidents is qualified as notifiable accidents.
This analysis examines accidents involving members of the public for 2017 and gives an overview for the 25 year period from 1993 to 2017.
It also compares rolling averages for the five-year base period (1993–1997) and the current five-year period (2013–2017).
One area of interest for electrical safety is protection of young people and the elderly age groups. This section examines the number of accidents involving young people in age groups up to 17 years old and elderly people in the 65 year and older age group.
Current trends
During 2017:
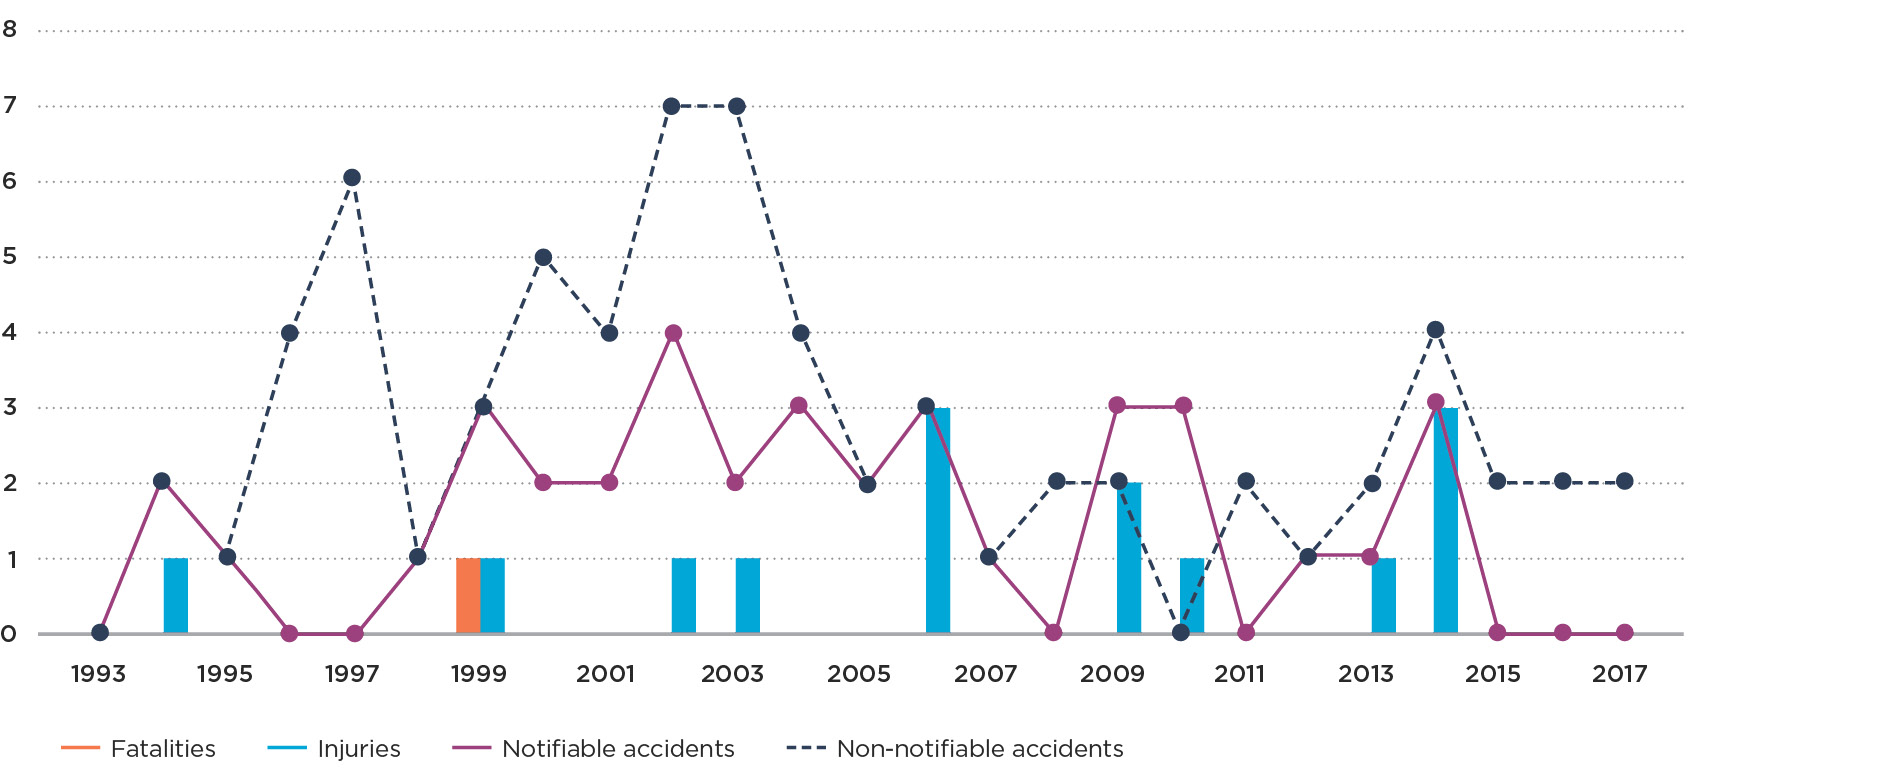
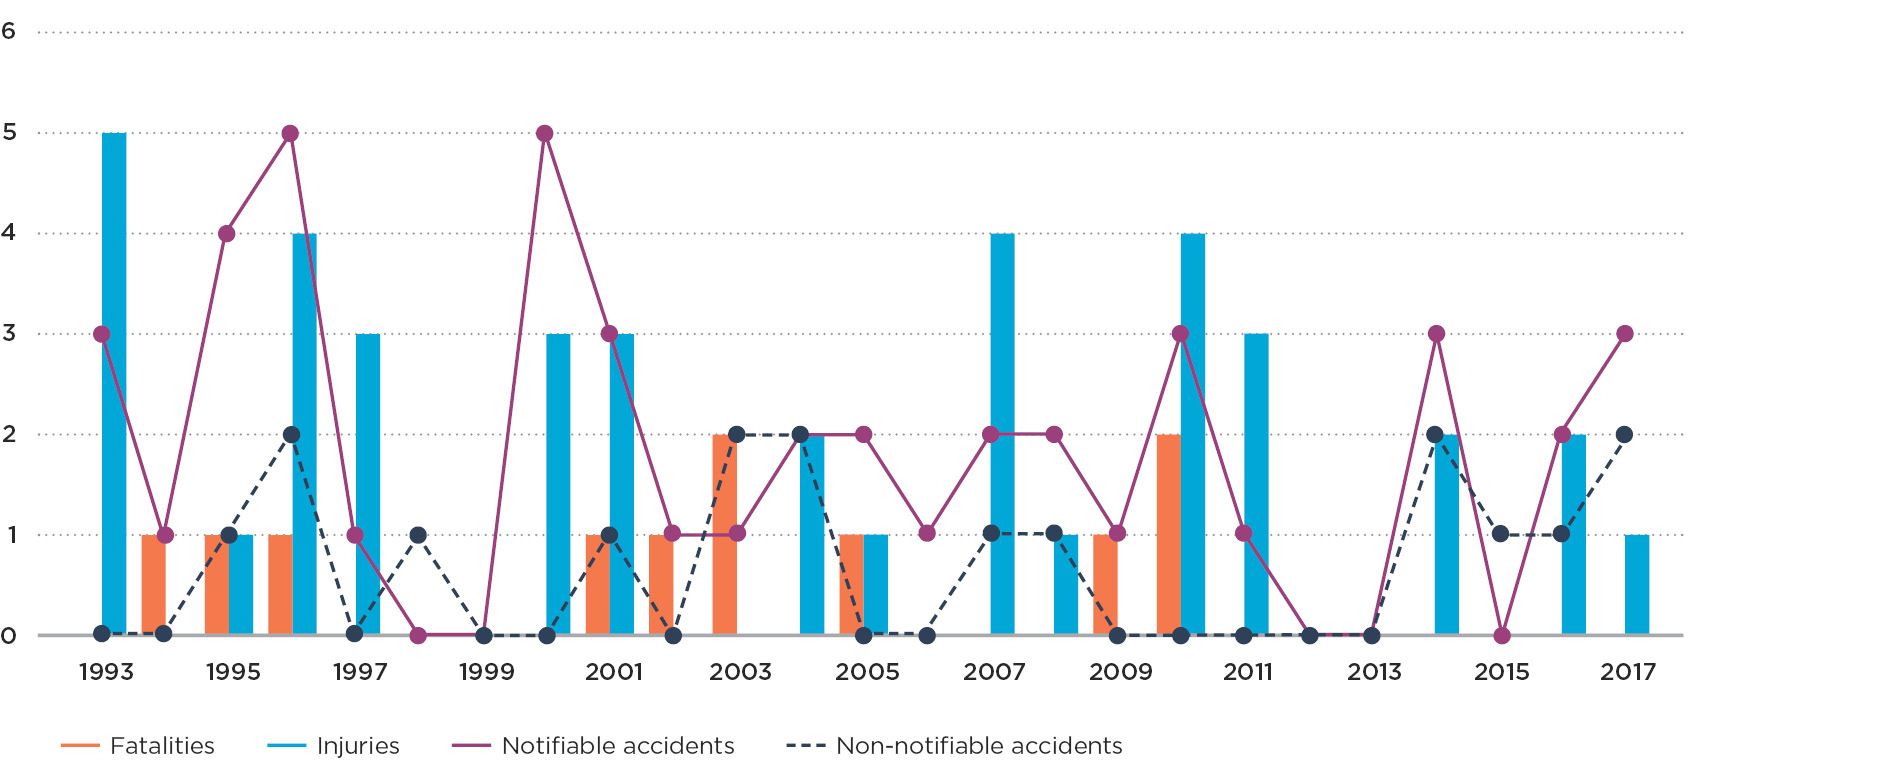
- There were no fatal electrical accidents and one accident resulting in injury. Over the past 25 years there has been an average of 1.9 fatalities per year.
- There was a single non-fire electrical accident involving members of the public, injuring one person. Over the past 25 years the average is 9.9 accidents per year.
- This injury notifiable accident involved 230 volt (standard low voltage) systems. The average number of accidents involving 230 volt systems over the past 25 years is 6.5 per year.
Longer term trends
Observations based on analysis of trends, consequence, and frequency for the 25 year period between 1993 and 2017:
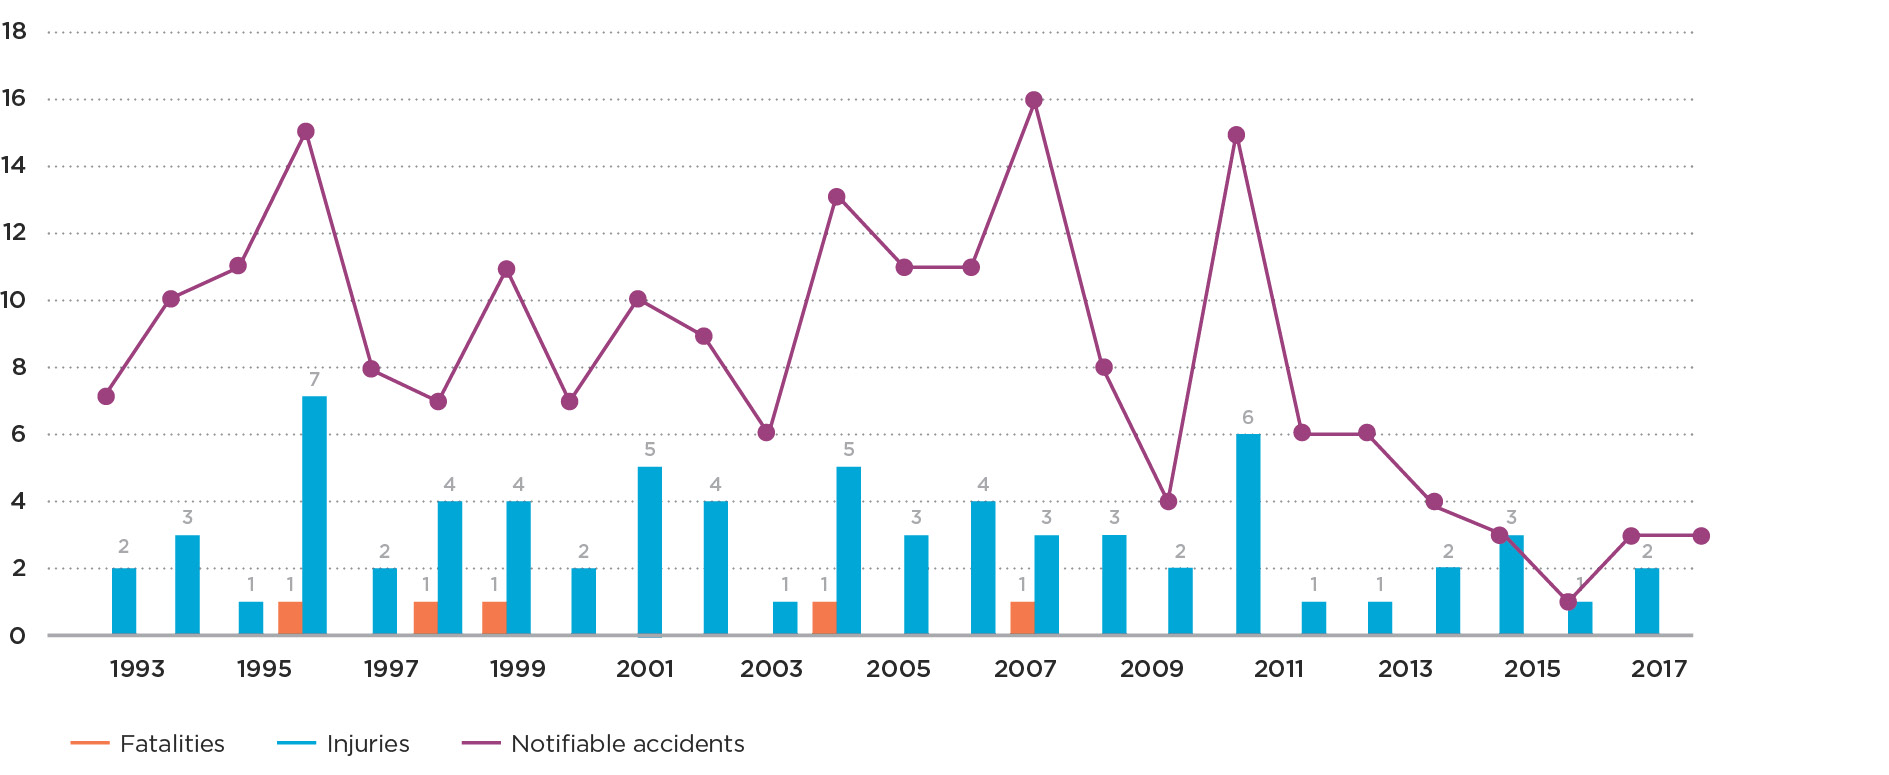
- There were 289 accidents involving members of the public which resulted in fatalities or injuries to 306 people (see Table 1).
- 48 of these were fatal accidents, each of which involved a single fatality. In six of the fatal accidents there was at least one other person injured.
- There were 247 injury accidents causing injury to a total of 258 people.
- Graph 1a shows considerable year-on-year variation in the number of fatal and injury accidents and there is no obvious significant trend in the annual number of fatal and injury accidents in this period. A five year rolling average accident number shows some reduction over the last 25 years.
- 113 (37%) of the total 306 victims are young people (aged 17 years and less), see Graph 1b.
| Accidents | Casualties | |
|---|---|---|
| Fatality | 42 | 42 |
| Fatality and injury | 6 | 13 |
| Injury | 241 | 251 |
| Total | 289 | 306 |
Table 1: Notifiable Electrical Accidents and Casualties
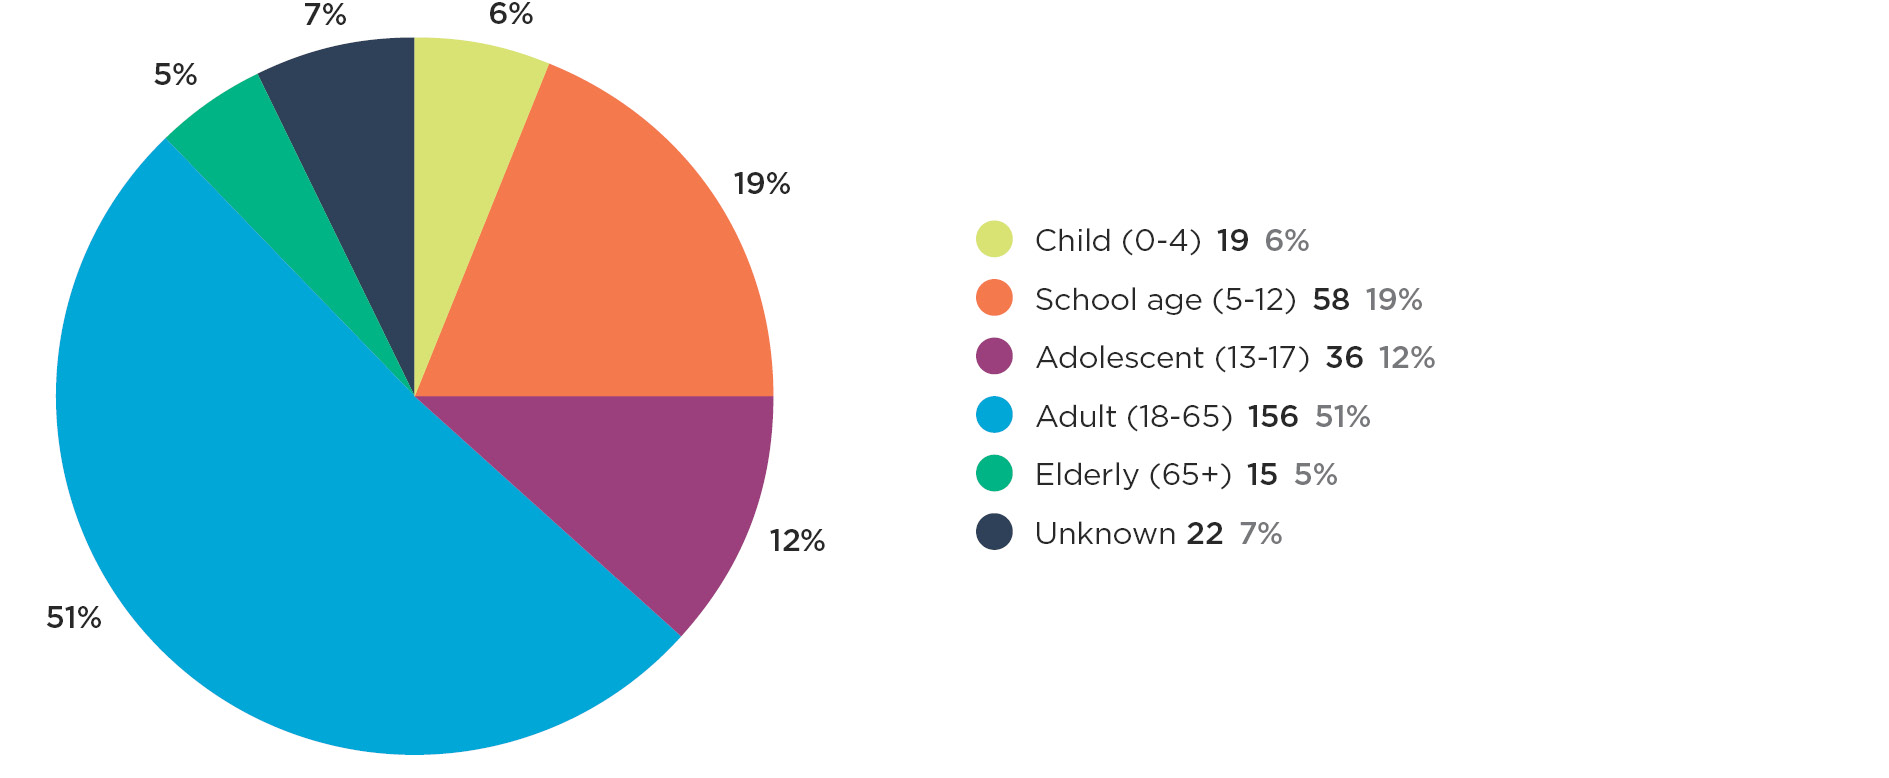
Age group
Accident data includes the general age group of involved parties (see Table 2) where it is known, or a reasonable estimate can be made.
|
Fatal Consequence6 |
Injury Consequence | |||
|---|---|---|---|---|
|
Age |
1993-2017 |
2013-2017 |
1993-2017 |
2013-2017 |
|
Young people (0-17) |
17 (17) | 1 (1) | 96 (91) | 8 (8) |
|
Child (0-4) |
4 (4) | 0 (0) | 15 (15) | 2 (2) |
|
School age (5-12) |
5 (5) | 1 (1) | 53 (53) | 4 (4) |
|
Adolescent (13-17) |
8 (8) | 0 (0) | 28 (26) | 2 (2) |
| Adult | 29 (29) | 2 (2) | 127 (126) | 19 (18) |
|
Elderly (65+) |
2 (2) | 0 (0) | 13 (12) | 1 (1) |
| Total | 48 (48) | 3 (3) | 258 (247) | 30 (29) |
Table 2: Age breakdown for notifiable electric shock accidents involving members of the public
- 35% of fatal accidents (17 fatalities) involved young people. One of these has occurred in the last five years.
- 91 injury accidents involved 96 young people and eight of these accidents, injuring eight, occurred in the last five years.
- There has been a significant reduction in the number of young people who were injured in electrical accidents during the current period compared with the base period. In the current period eight (27%) out of 30 injuries involved young people compared with 30 (45%) out of 67 injuries in the base period.
- Only 5% (14) of the total 289 accidents involved people aged 65 years or over. This is a relatively small number compared with the age profile of the population as a whole. As numbers are small no further analysis has been carried out.
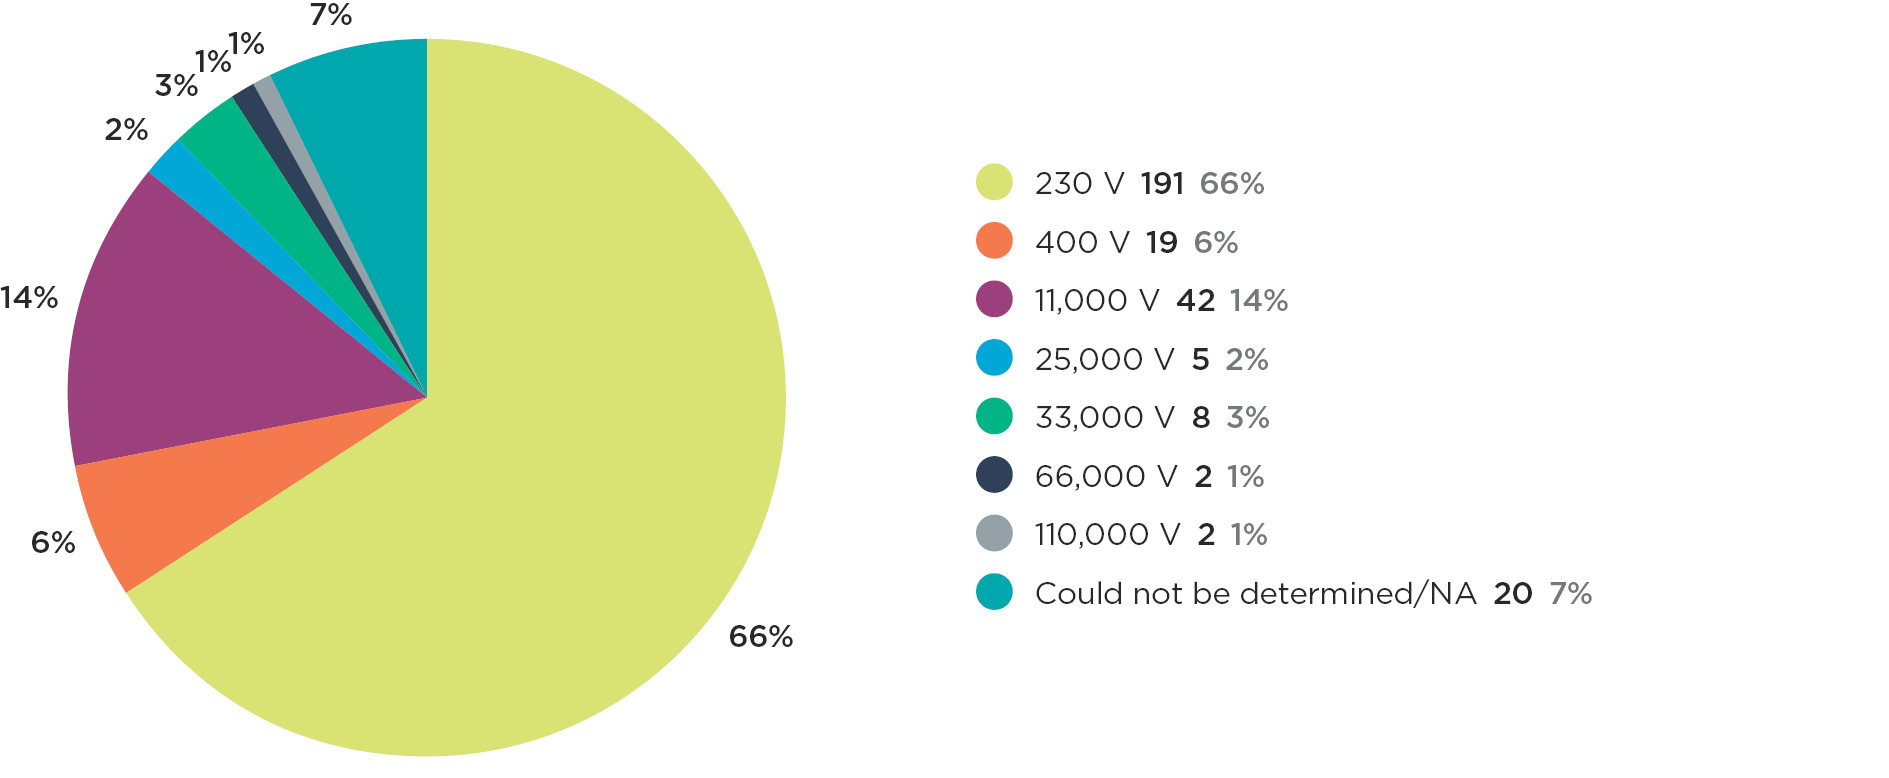
Voltage
- The standard voltage in domestic installations is 230 V. This is the voltage that people normally interact with in their homes. About two thirds of accidents involving members of the public involve 230 V (see Graph 1c).
- 31 (65%) of the 48 fatal accidents and 162 (66%) of the 247 injury accidents involved 230 volt systems; two (4%) fatal accidents and 17 (7%) of injury accidents involved 400 volt systems; and eight (17%) of fatal accidents and 37 (15%) of injury accidents involved 11,000 volt systems (see Table 3).
- Of the 48 fatal accidents, 17 of the victims were young people. 11 of these cases involved 230 volt systems.
- 67 (35%) of the 191 fatal and injury accidents associated with 230 volt systems involved young people.
|
Fatal Consequence7 |
Injury Consequence | |||
|---|---|---|---|---|
| Voltage groups | 1993-2017 | 2013-2017 | 1993-2017 | 2013-2017 |
| 230 | 31 (31) | 2 (2) | 165 (162) | 23 (22) |
| 400 | 2 (2) | 0 (0) | 17 (17) | 3 (3) |
| 11,000 | 8 (8) | 1 (1) | 39 (37) | 4 (4) |
| 25,000 | 2 (2) | 0 (0) | 3 (3) | 0 (0) |
| 33,000 | 2 (2) | 0 (0) | 7 (7) | 0 (0) |
| 66,000 | 1 (1) | 0 (0) | 1 (1) | 0 (0) |
| 110,000 | 0 (0) | 0 (0) | 6 (2) | 0 (0) |
| Total | 48 (48) | 3 (3) | 258 (247) | 30 (29) |
Table 3: Voltage breakdown for notifiable electric shock accidents involving members of the public
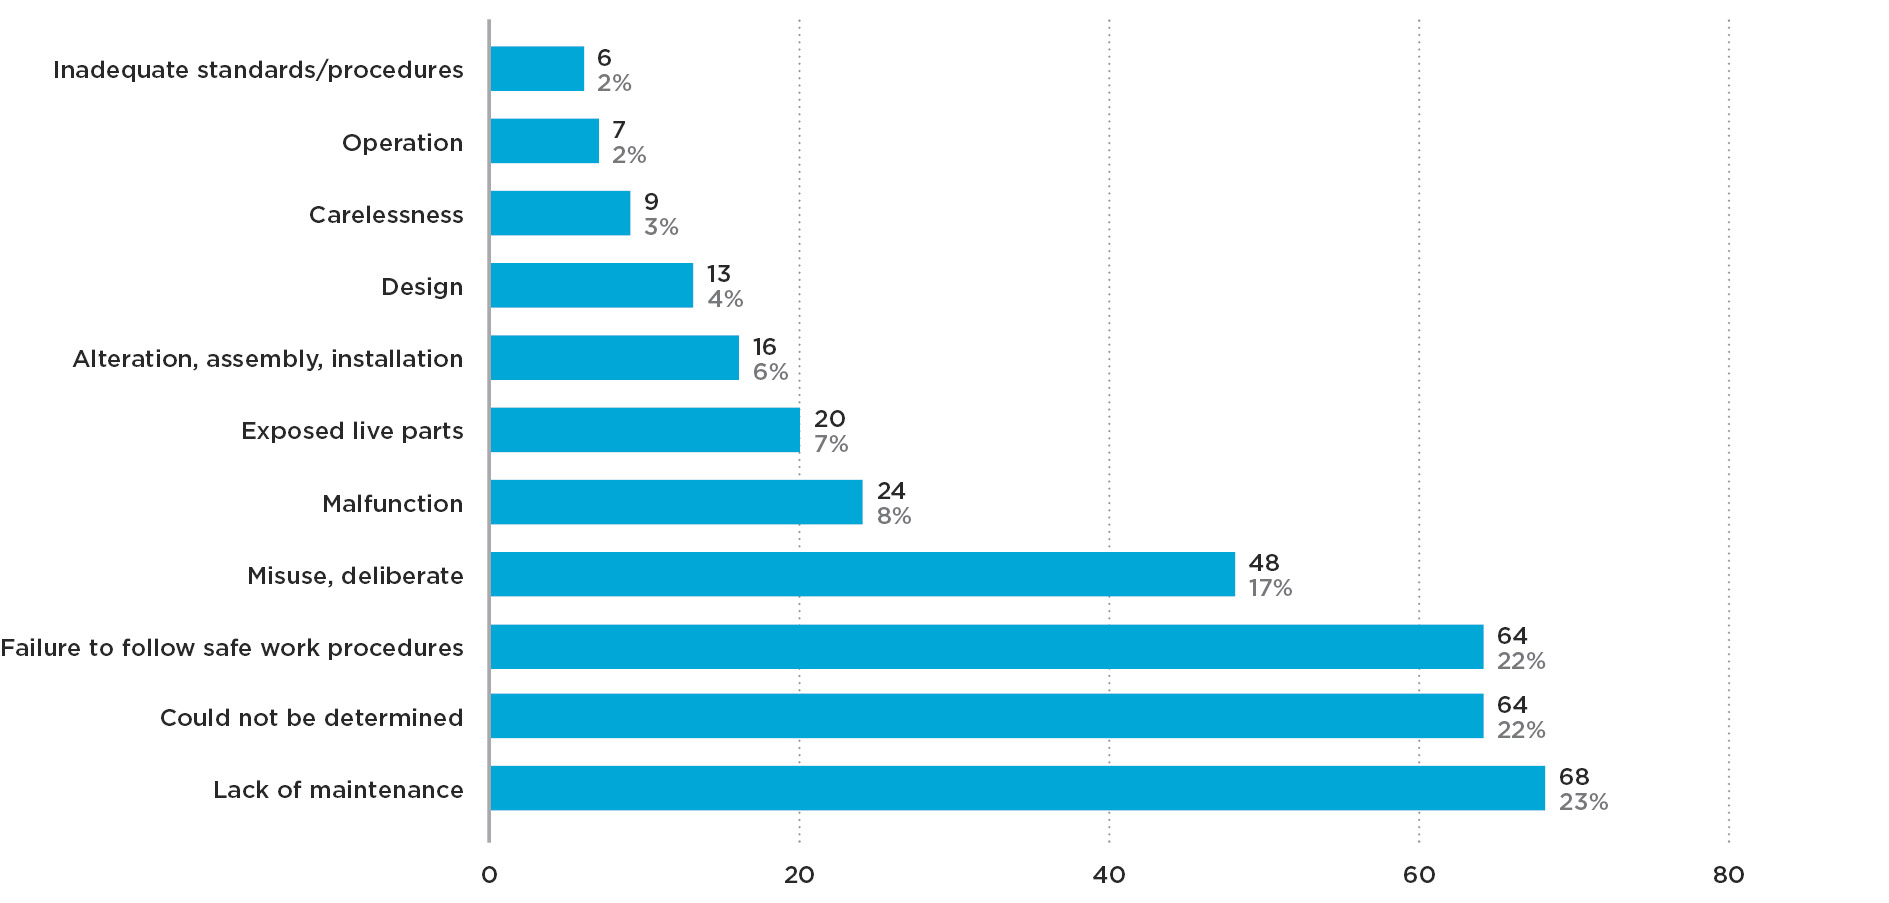
Causal factors
Investigations seek to identify a causal factor or factors. These factors fall into one or more broad categories as indicated in Graph 1d. Because there can be a combination of one or more causal factors for an accident, percentages do not add to 100%.
- In cases involving members of the public the most common causes of electrical accidents were lack of maintenance in 68 (20%) cases, and misuse actions in 48 (14%) cases (see Graph 1d).
- In 11 (23%) fatal electrical accidents, misuse of equipment was identified as the cause.
- Table 4 gives the most common causes of electrical accidents over the past 25 years, and over the past five years.
|
Period |
Period | |
|---|---|---|
| Main causes |
Lack of maintenance – 23% Failure to follow safe work procedures – 22% Misuse – 17% |
Lack of maintenance – 17% Failure to follow safe work procedures – 30% Misuse – 23% Exposed to live parts – 23% |
Table 4: Factors in notifiable electrical accidents involving members of the public
Equipment
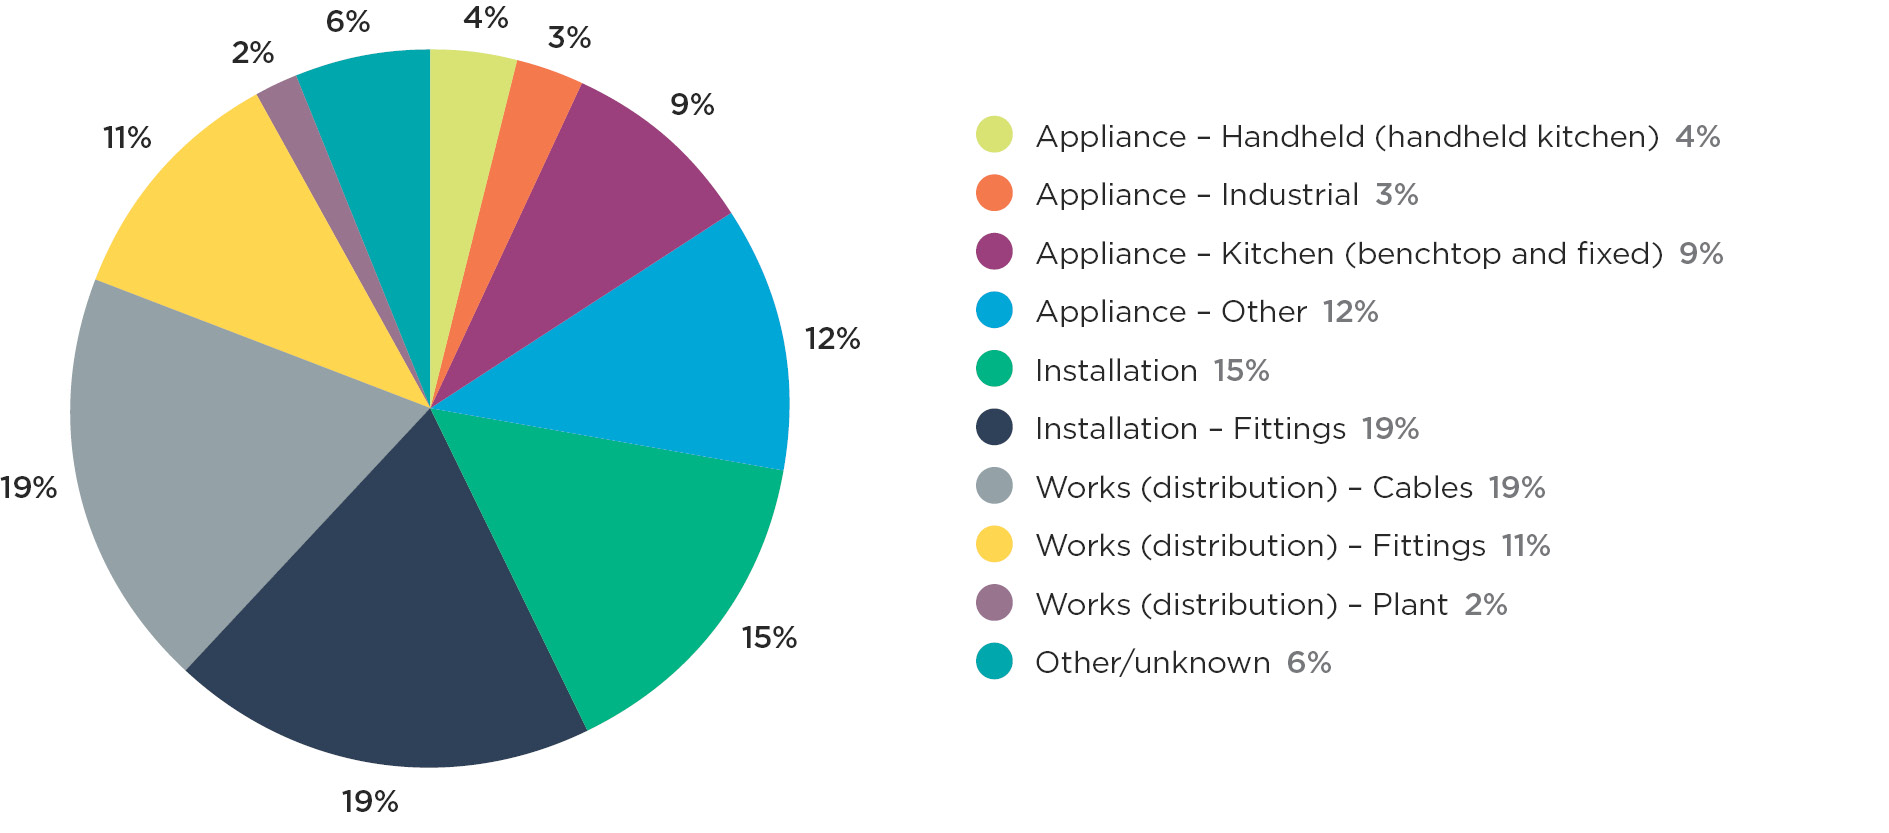
Over 95% of accidents that involved members of the public were associated with one of five categories of equipment (see Graph 1e):
- Appliances (27%)
- Domestic installation wiring (15%)
- Installation fittings8 (19%)
- Works or distribution cable (19%)
- Works distribution fittings (12%)
Environment
Graph 1f gives a more detailed breakdown of electrical accidents by environment type. About half (52%) of the accidents occurred in the domestic environment. 18% of accidents occurred in the commercial environment and a similar level (17%) of accident occurred near works.
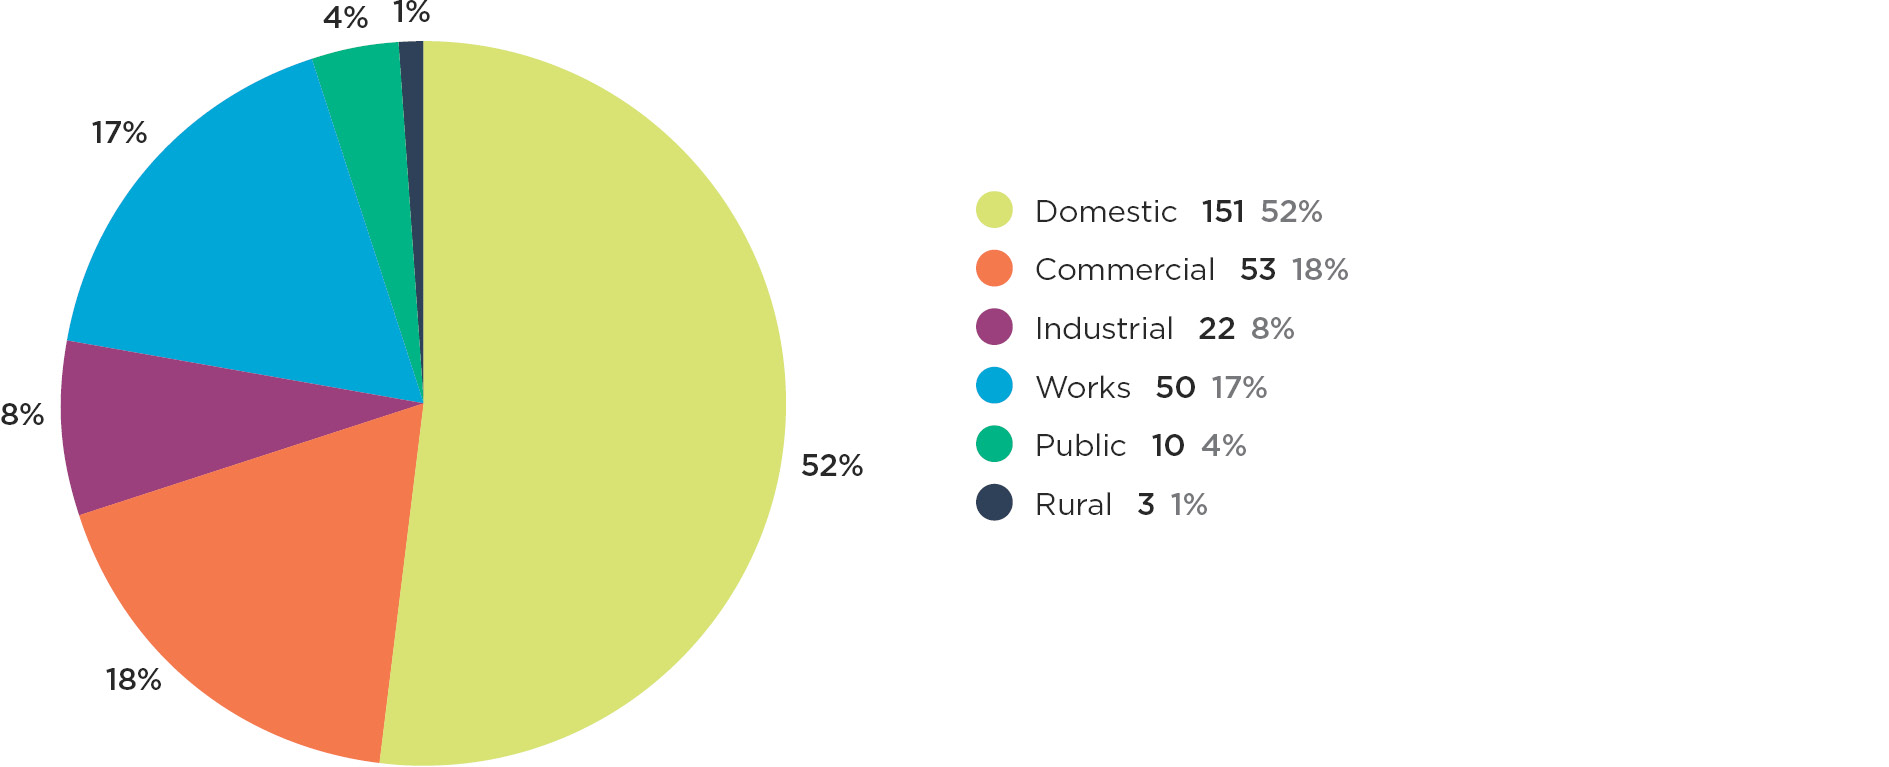
- 28 (58%) of the 48 fatal accidents and 123 (50%) of the 247 injury accidents occurred in the domestic environment. 230 volt domestic systems were involved in 26 of the 28 domestic environment fatal accidents and in 105 of the 123 injury accidents.
- 10 (21%) of the 48 fatal accidents and 43 (17%) of the injury accidents occurred in the work environment. Three fatal and 21 injury accidents involved 11,000 volt system.
5. Natural gas accidents
This section deals with notifiable and non-notifiable accidents which were reported to Energy Safety involving natural gas (gas). It includes natural gas-related accidents of all types, including fires and explosions, whether or not there were fatalities, or any loss related to property. All non-notifiable accidents, except for those reported in bulk,9 are included in this analysis.
This analysis examines accidents involving members of the public for 2017 and also for the 25 year period from 1993 to 2017. It includes a comparison between the base period (1993–1997) and the current five year period (2013–2017).
Historically data relating to gas accidents did not include the age of the victim. Recording data related to the age group of the victim for gas started with the introduction of an integrated case management system (ESI) in 2008. This section identifies general trends and examines general categories of appliances and other equipment involved in accidents.
Current trends
Examination of notifiable gas accidents shows that during 2017:
- There were no fatal or injury natural gas accidents.
In the past 25 years there have been 0.2 fatal accidents and 2.8 injury accidents per year on average.
- There were three notifiable accidents and two of them resulted in fire, explosion, or both, and the other resulted in a gas leak. Water heaters were involved in two accidents, and a gas installation was involved in the other.
- Ten non-notifiable accidents were reported. A small rise (average 5 per year to 11 per year) in non-notifiable accidents occurred in the last two years compared to the previous six years (2010-2015). However, the average accident number over the first 17 years (1993—2009) was 32.
- Over the last two years, four non-notifiable distribution accidents (involving mains, services, and regulator stations etc.) were reported after five years of zero accident reporting. The average distribution accident number over the first 18 years (1993-2010) was 16.7. A likely reason for a decline in distribution accident reporting to Energy Safety was the transfer of responsibility for workplace accidents to investigate under workplace safety legislation (then Department of Labour) in 2009.
Longer term trends
Observations based on analysis of trends, consequence, and frequency for the 25 year period between 1993 and 2017:
- There were a total of 205 notifiable accidents. 144 (70%) of these are non-casualty accidents that resulted in property damage.
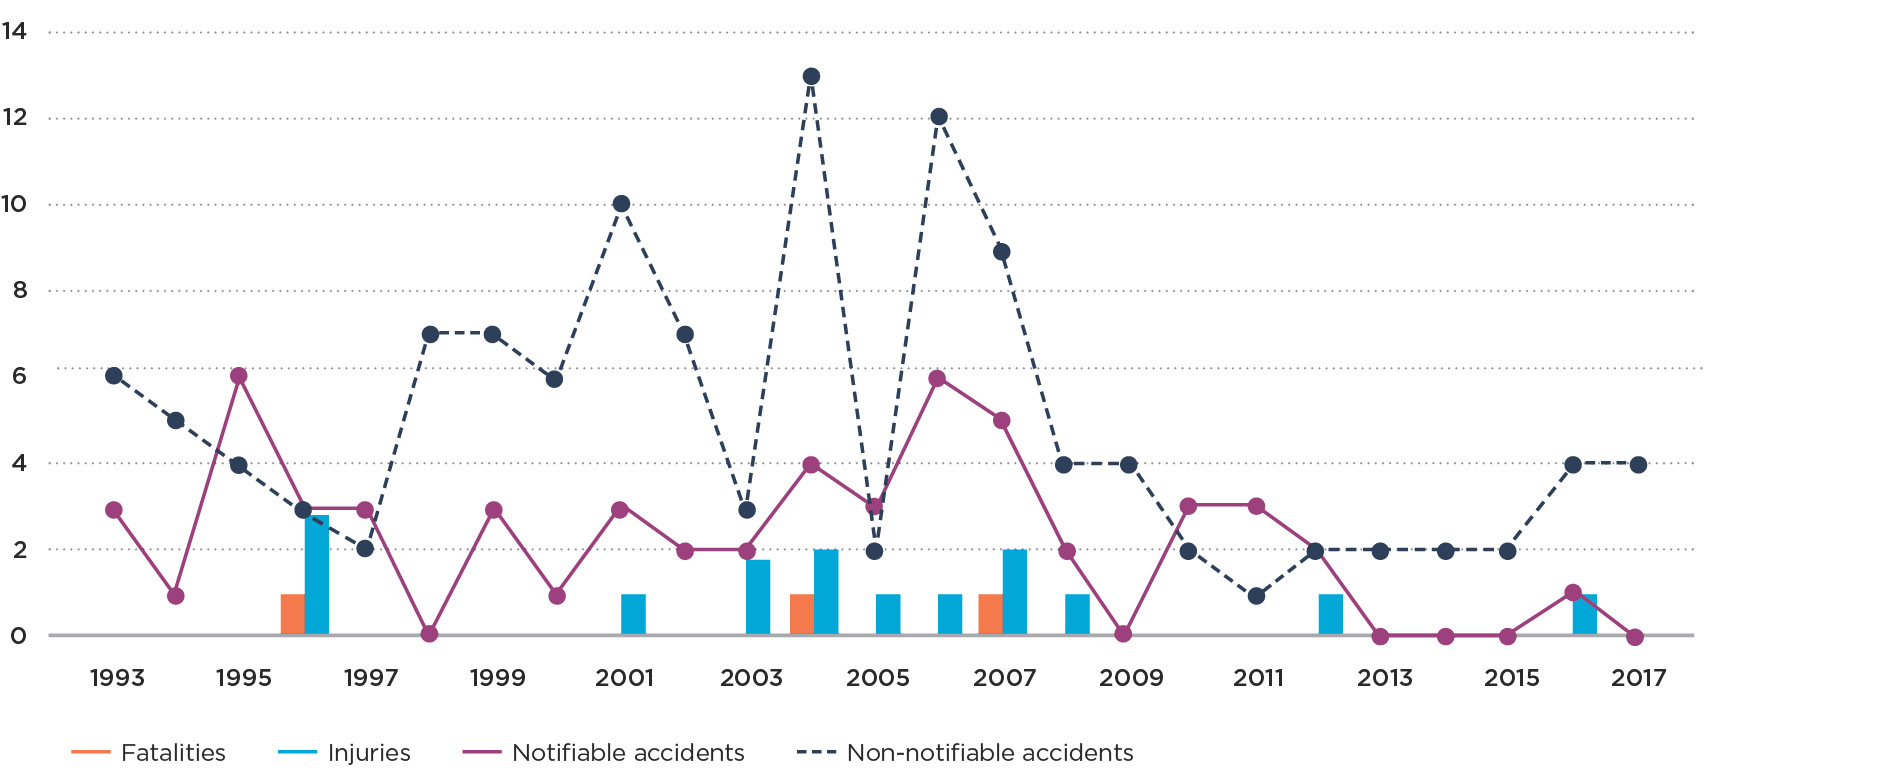
- There have been five fatal accidents (with five fatalities) and 58 injury-accidents injuring 71 people (see Graph 2a). With this small number spread over a twenty five year period it is not possible to identify a trend for fatal and injury accidents.
- The last fatal accident occurred in 2007. Fixed space heaters were involved in three of these fatal accidents and cookers10 and water heaters have each been involved in one accident.
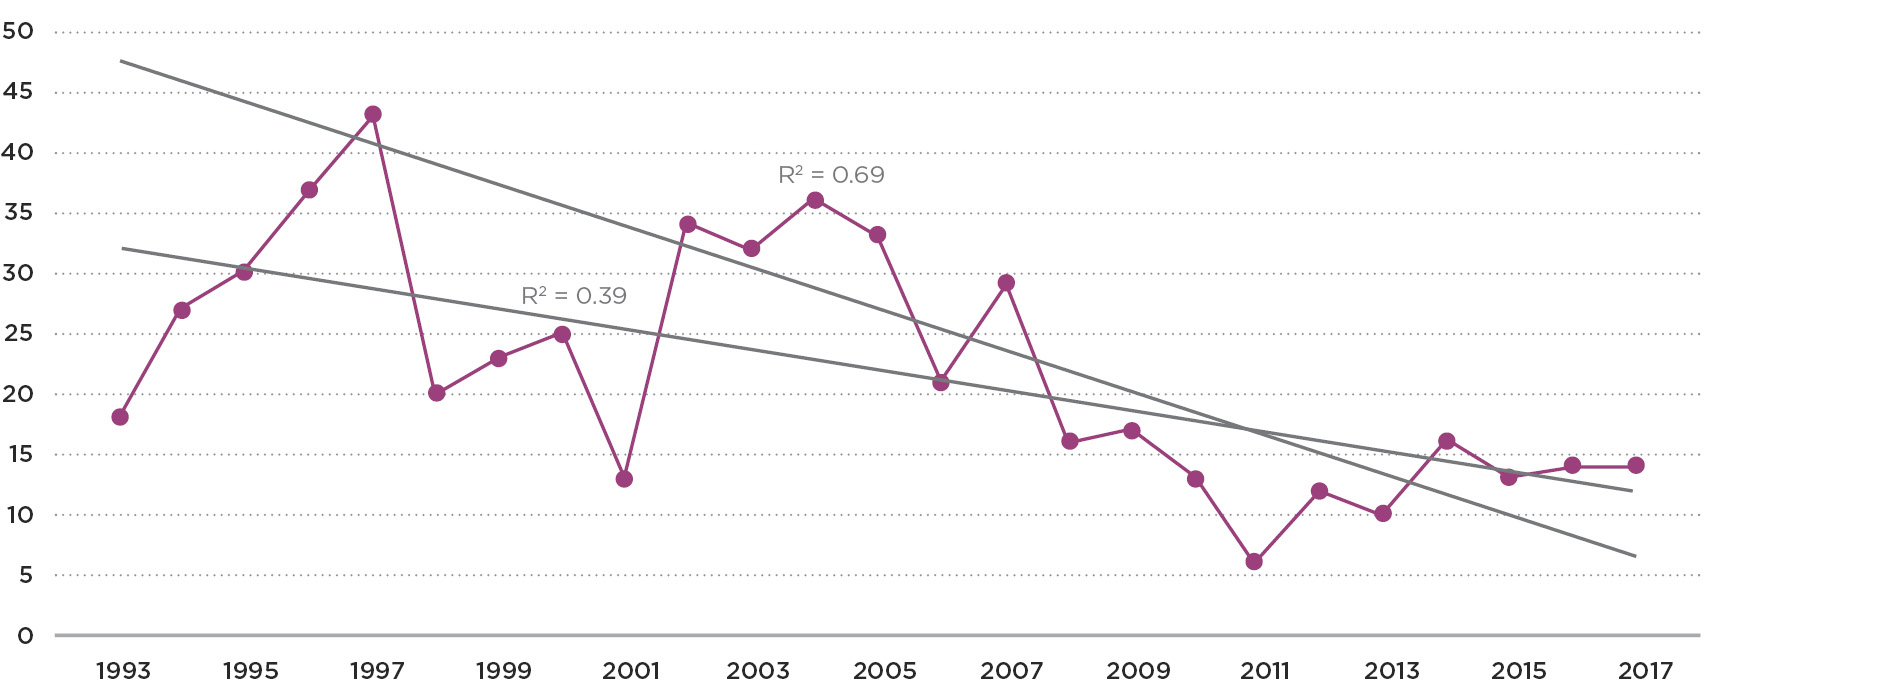
- A total of 612 non-notifiable accidents were reported to Energy Safety. A reduction in non-notifiable accidents is observed over the last 12 years and a very clear downward trend is noticeable over the last nine years (2009-2017) (see Graph 2b).
- 37 non-notifiable accidents were reported in the last five years compared with 121 in the initial five-year period, a decrease of about two thirds (see Graph 2b). The notification of non-notifiable accidents related to gas distribution11 has dropped in the last nine years12.
- The number of non-notifiable accidents reported by the gas industry has declined to 12 (2.4 pa) over the last five years compared to the base period 44 (8.8 per year). More non-notifiable gas distribution accidents were reported by the gas industry during 1998–2002 (18.0 per year) and 2003-2008 (15.3 per year) periods.
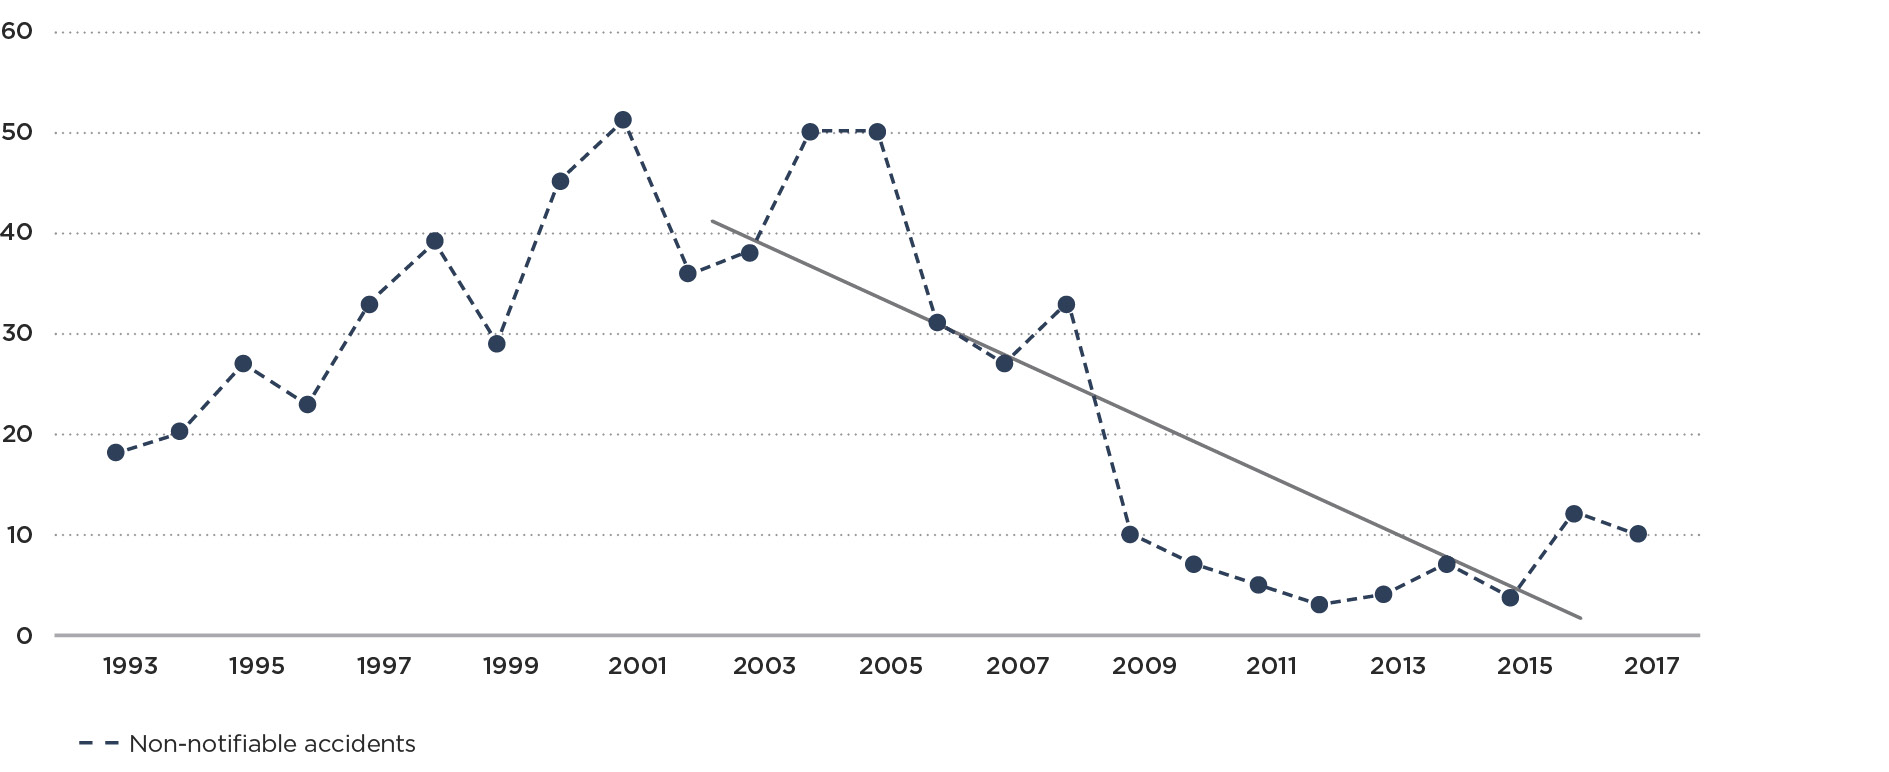
- 43% of non-notifiable accidents were reported to Energy Safety by the gas industry.
Causal factors
Table 5 gives the most common causes of notifiable natural gas accidents over the past 25 years, and over the past five years.
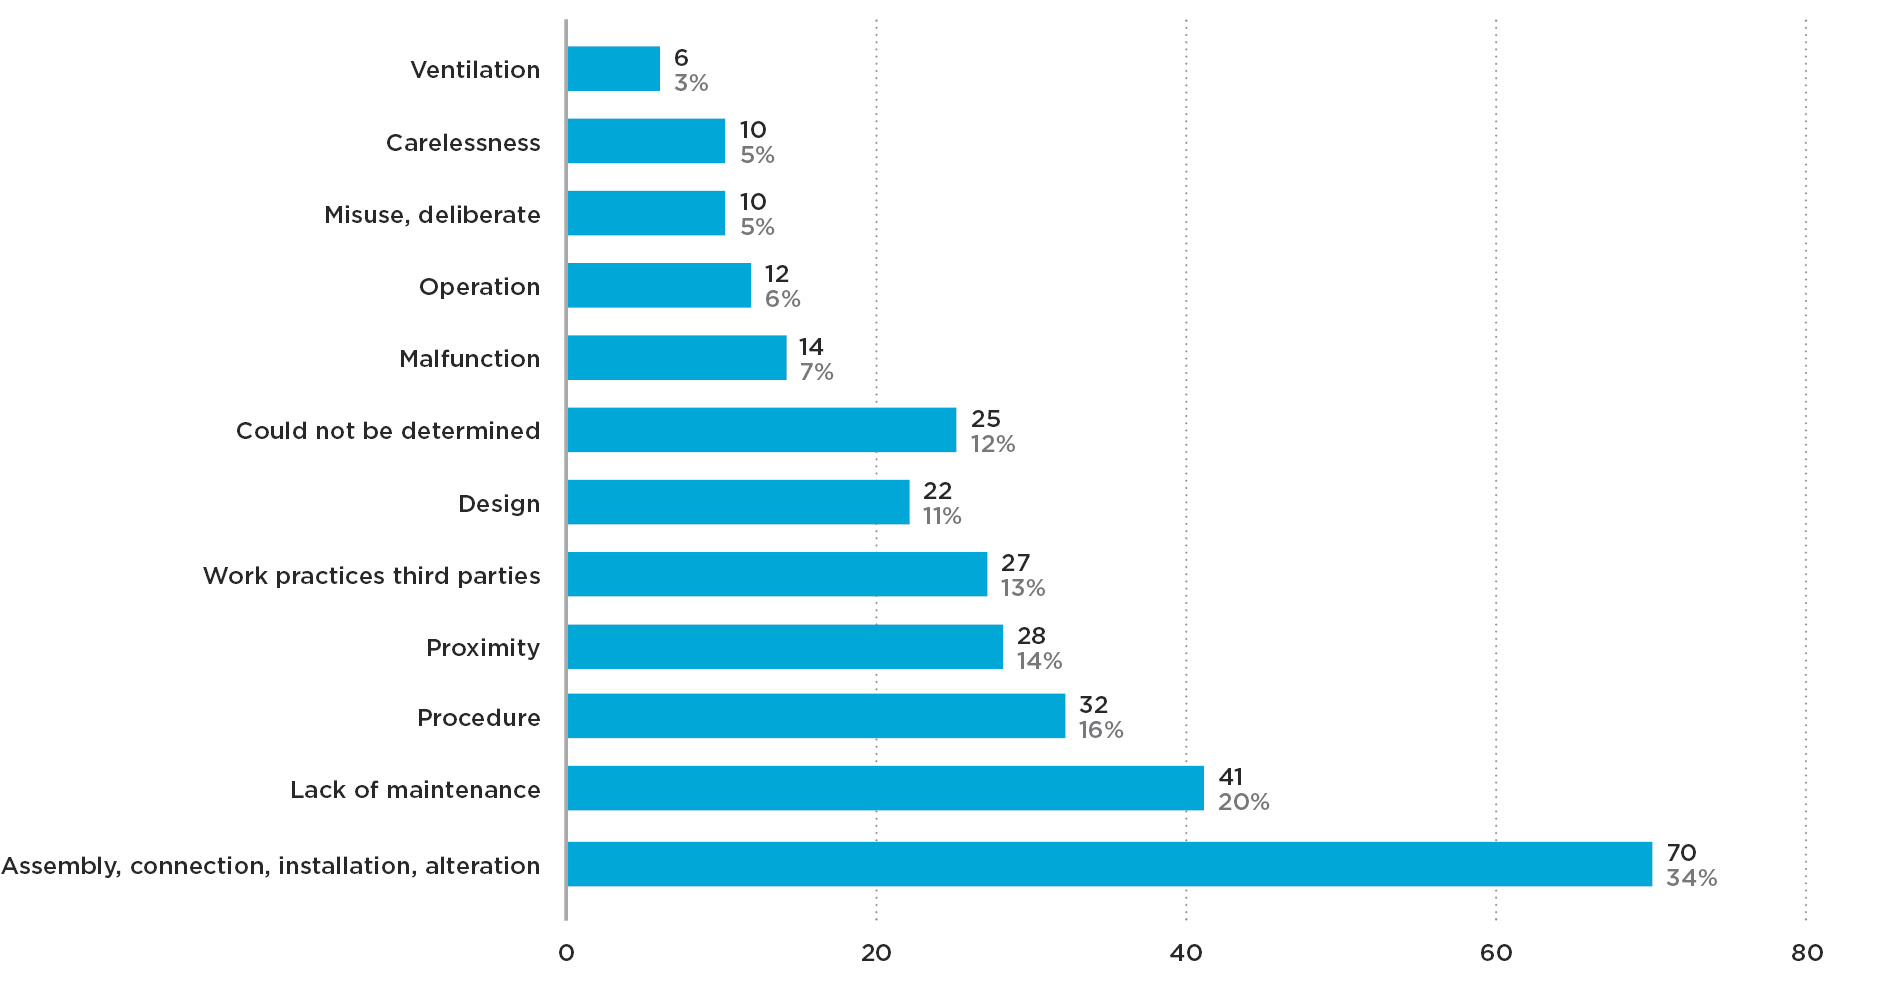
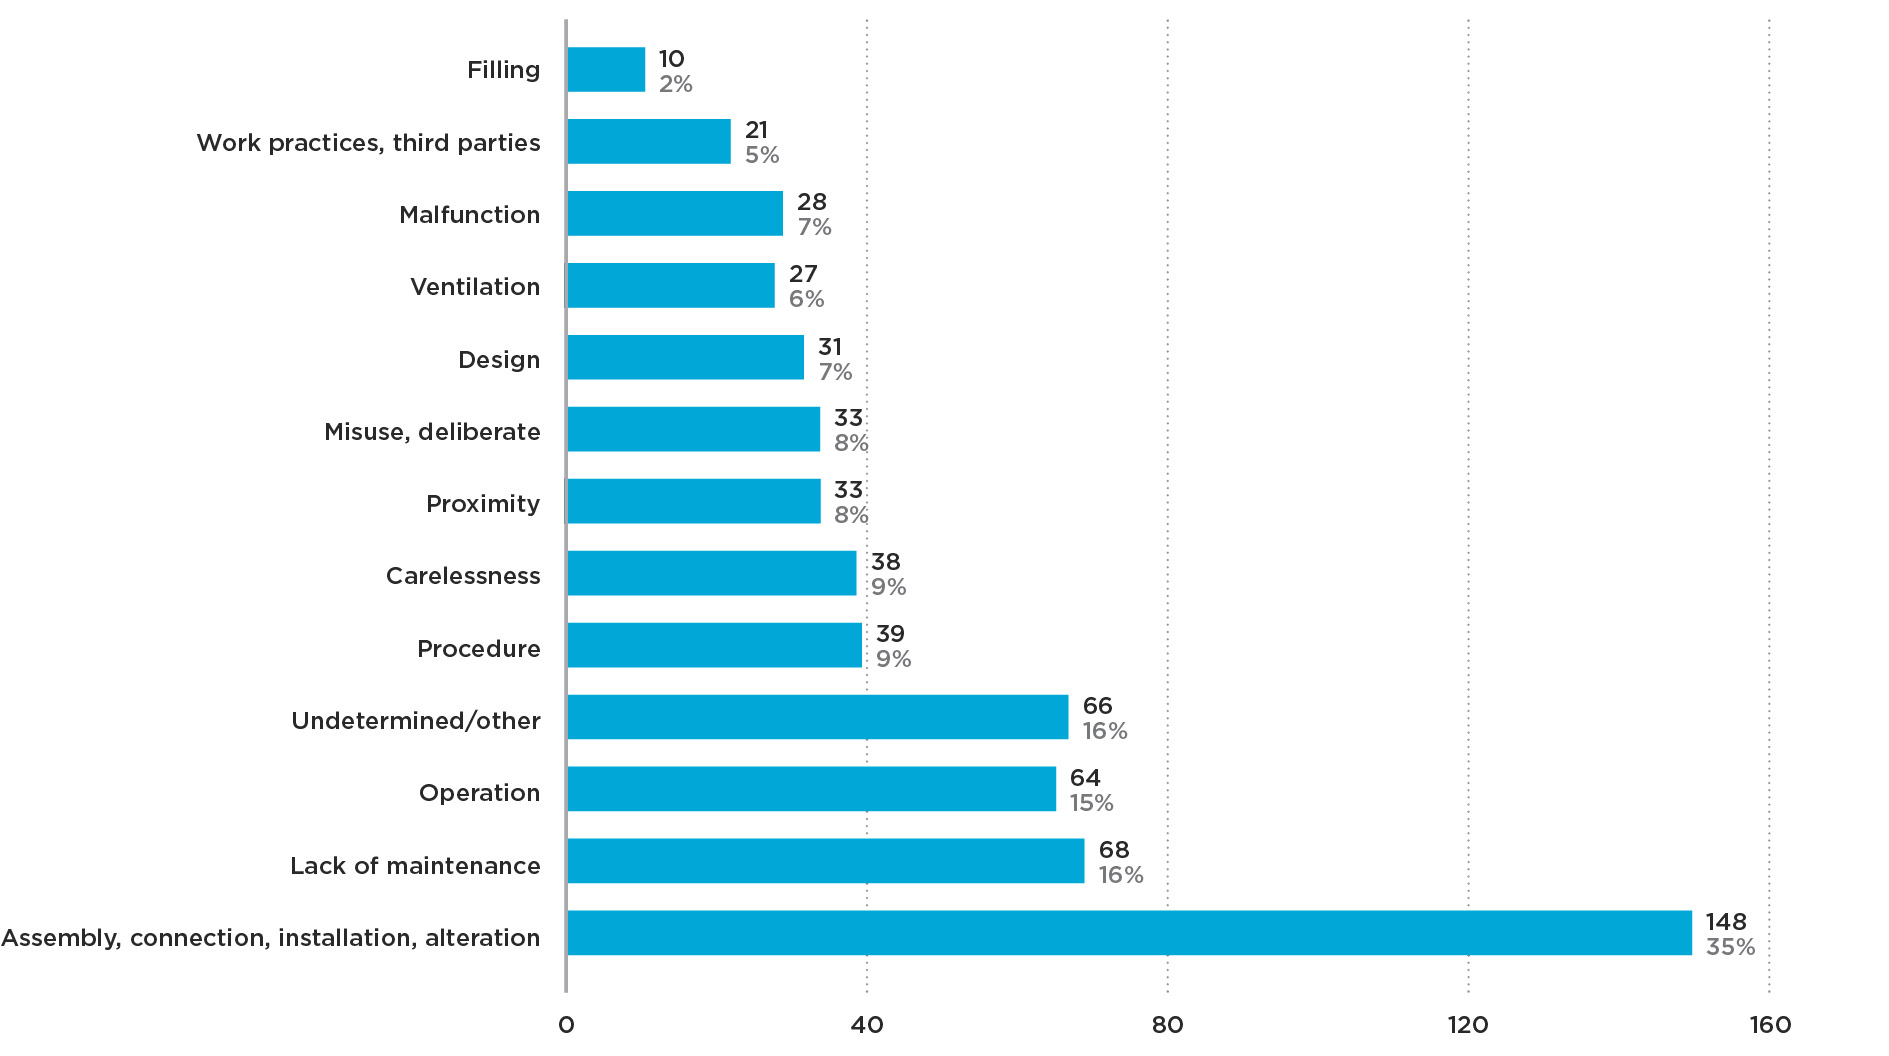
The most common causes13 identified of notifiable accidents over the last 25 years (see Graph 2c) were:
- Assembly, connection, installation, alteration14 – 70 (34%)
- Lack of maintenance – 41 (20%)
- Not following appropriate procedure – 32 (16%)
- Appliances too close to combustible products (proximity) – 28 (14%)
- Work practices and third-party damage – 27 (13%)
|
Period |
Period | |
|---|---|---|
| Main causes |
Assembly, connection, installation, alteration – 34% Lack of maintenance – 20% Procedure – 16% Work practice, interference by third parties, operation error – 13% |
Assembly, connection, installation, alteration – 21% Lack of maintenance – 29% Procedure – 14% Malfunction – 14% Misuse or deliberate – 14% Carelessness – 14% |
Table 5: Factors in notifiable natural gas accident involving members of the public
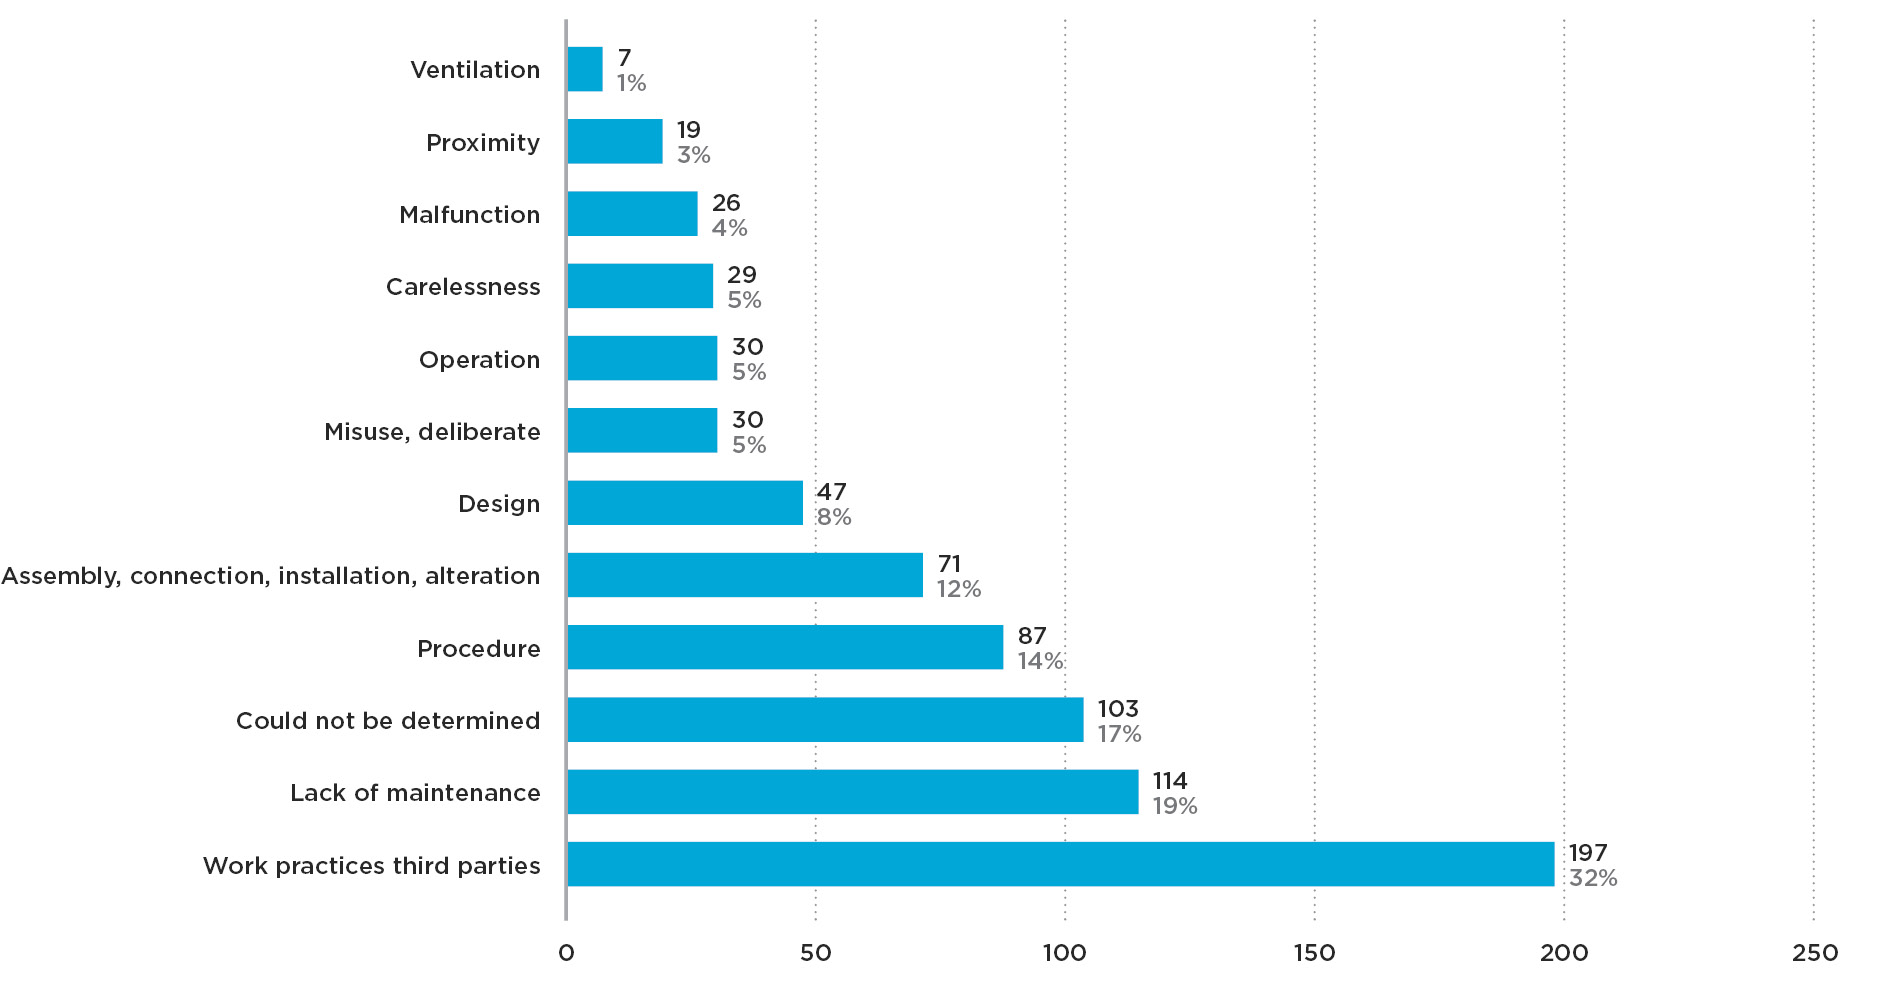
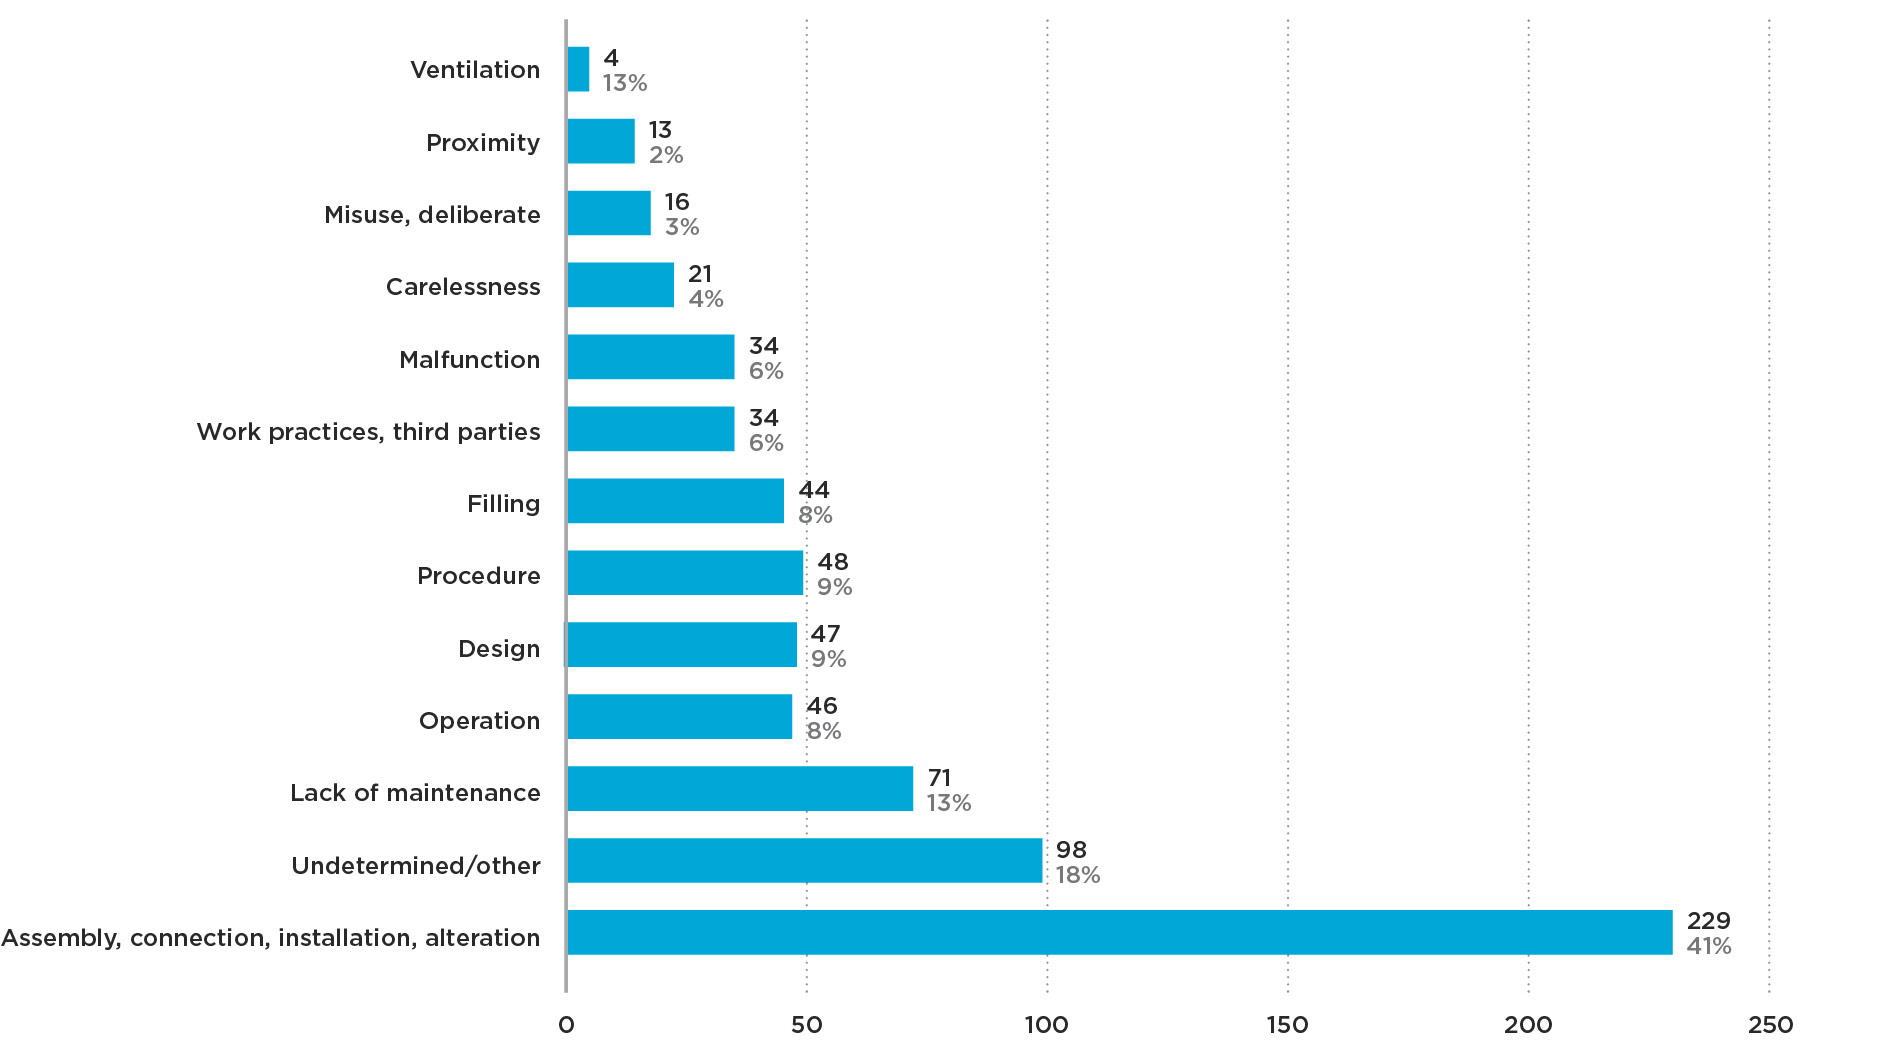
- A third (197) of the non-notifiable accidents reported were caused by failure to follow correct work practices, including third-party incidents involving non-gas industry workers. 114 (19%) were caused by lack of maintenance, 71 (12%) byassembly, connection, installation, alteration15, and 87 (14%) by not following correct procedures (see Graph 2d).
Equipment type
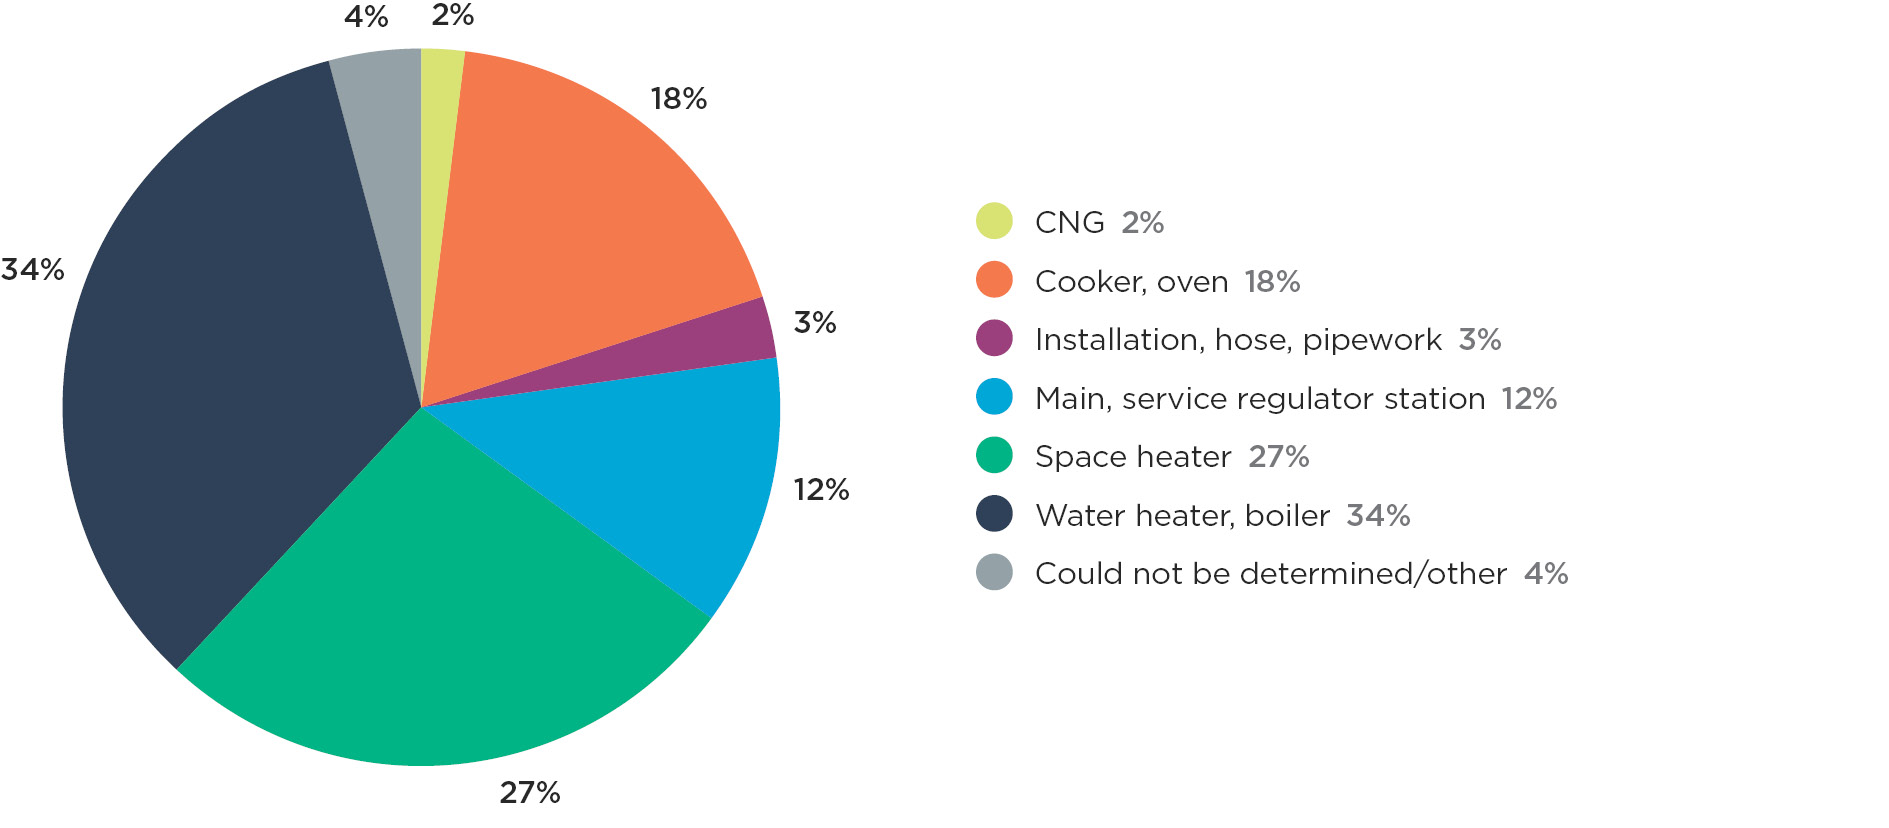
Table 6 and table 7 give a more detailed breakdown of natural gas casualty and all natural gas accidents by equipment type. Three categories of appliance were involved in about 80% of notifiable accidents (see Graph 2e).
- Water heaters or boilers – 69 (34%)
- Space heaters – 56 (27%)
- Cooking appliances – 37 (18%)
Over 90% of these accidents involved a fire or explosion.
|
|
Fatal Consequence16 |
Injury Consequence | ||
|---|---|---|---|---|
| Equipment type |
1993-2017 |
2013-2017 |
1993-2017 |
2013-2017 |
| Cookers and ovens | 1 (1) | 0 (0) | 14 (11) | 4 (3) |
| Space heaters | 3 (3) | 0 (0) | 13 (12) | 1 (1) |
| Water heaters | 1 (1) | 0 (0) | 18 (15) | 2 (2) |
|
Mains/service |
0 (0) | 0 (0) | 15 (12) | 0 (0) |
| Total | 5 (5) | 0 (0) | 71 (58) | 8 (7) |
Table 6: Breakdown of natural gas casualty accidents involving members of the public by equipment type
|
|
Notifiable Accidents17 |
Non-notifiable Accidents | ||
|---|---|---|---|---|
|
Equipment type |
1993-2017 |
2013-2017 |
1993-2017 |
2013-2017 |
| Cookers and ovens | 37 (1.5) | 4 (0.8) | 69 (2.8) | 12 (2.4) |
| Space heaters | 56 (2.2) | 1 (0.2) | 123 (4.9) | 14 (2.8) |
| Water heaters | 69 (2.7) | 6 (1.2) | 32 (1.3) | 2 (0.4) |
|
Mains/service |
25 (1.0) | 1 (0.2) | 305 (12.1) | 4 (0.8) |
| Total | 205 (8.2) | 14 (2.8) | 612 (24.5) | 37 (7.4) |
Table 7: Breakdown of natural gas accidents involving members of the public by equipment type
- About half (12 of 25) of the notifiable accidents in the distribution system caused injury to 15 people.
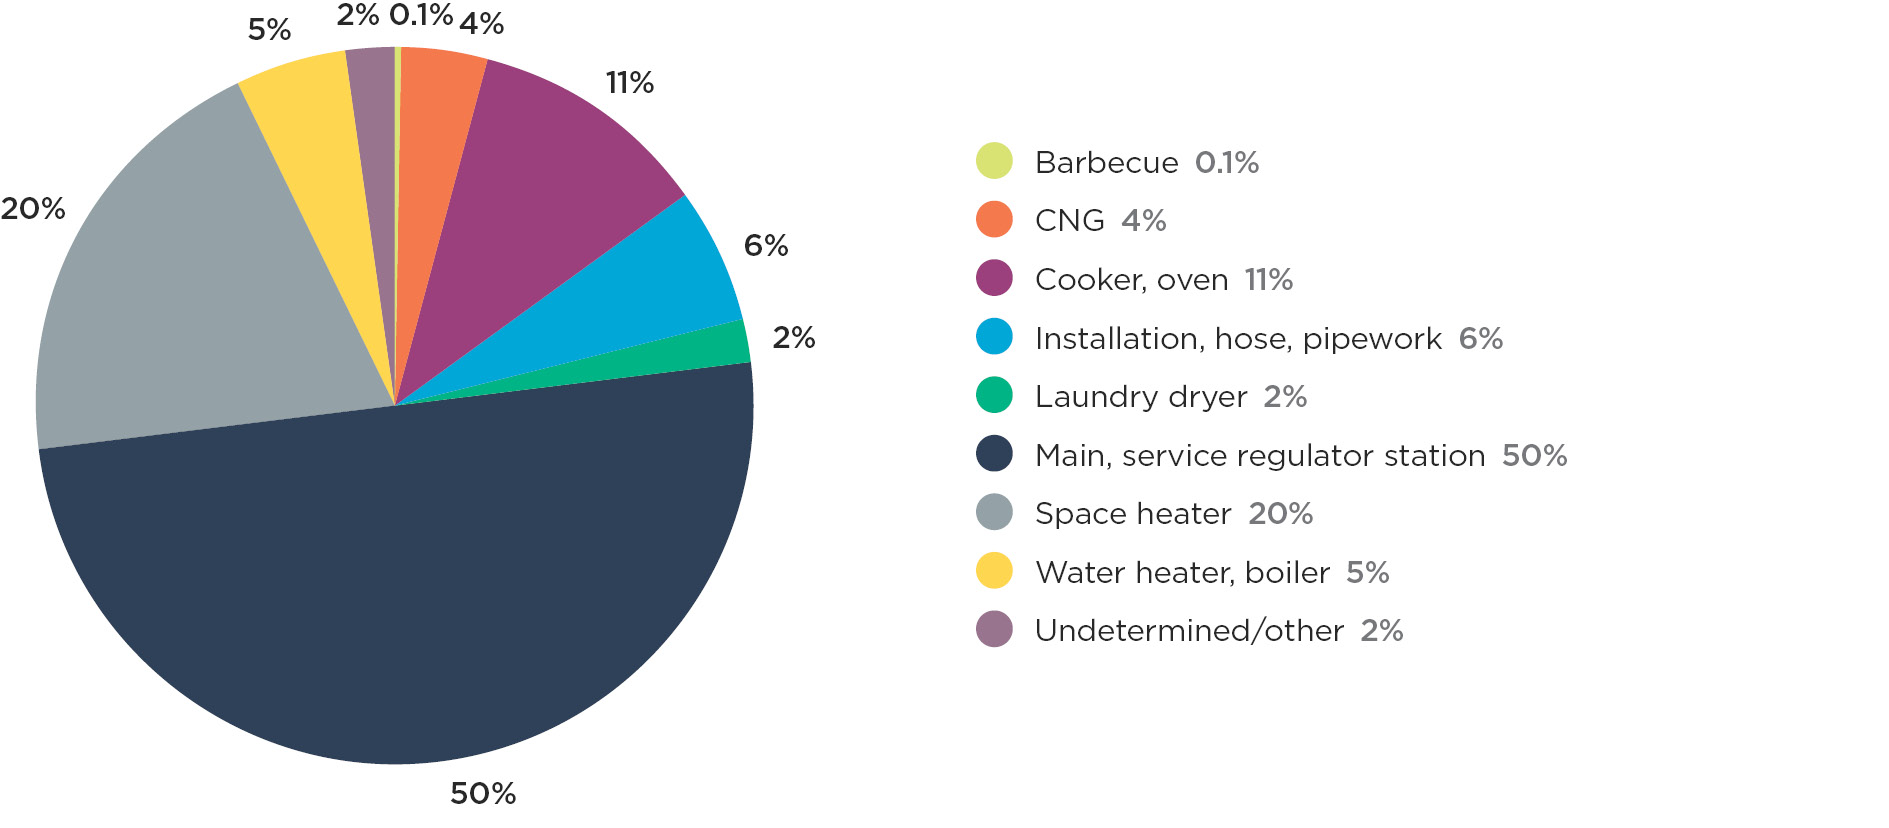
- About half (305) of the 612 non-notifiable accidents reported to Energy Safety involved distribution equipment18 (see Graph 2f) with a gas leak or escape being the outcome in over 80% of cases, and fire in 9% of these cases. About 57% of distribution accidents, including third-party strikes, involved failure to follow correct work practices.
- Over a quarter (192 or 31%) of the 612 non-notifiable accidents reported to Energy Safety involved heating equipment or cooking equipment. Fire was the outcome in about three quarters of these accidents.
Cookers and ovens
- 18% (37) of the 205 notifiable accidents and 11% (69) of the 612 non-notifiable accidents involved cookers or ovens. Cookers and ovens were involved in one fatality (in 1999) and injury to 14 people (in 11 injury accidents), see Graph 2g.
- 20% of the total natural gas notifiable accident injuries involved gas cookers or ovens. In the past 25 years there have been, on average, 1.5 notifiable accidents and 2.8 non-notifiable accidents involving cookers per year.
- 15 (41%) notifiable accidents reported were caused by lack of maintenance and 11 (30%) were caused by assembly, connection, installation and alteration.
- 21 (30%) non-notifiable accidents reported were caused by lack of maintenance, 13 (19%) were caused by operation issue and 17 (25%) caused by assembly, connection, installation and alteration.
Space heaters
- 27% (56) of the 205 notifiable accidents and 20% (123) of the 612 non-notifiable accidents involved space heaters. Space heaters were involved in three fatalities (three fatal accidents) and injury to 13 people (12 injury accidents). The last fatal accident involving a space heater occurred ten years ago in 2007 (see Graph 2h).
- 21% of the total injury accidents involved space heaters in the past 25 years. In the past 25 years there have been, on average, 2.2 notifiable accidents and 4.9 non-notifiable space heater accidents per year.
- 14 of 56 notifiable space heater accidents caused three fatalities and injury to 13 people. Space heaters accounted for 20% of the total non-notifiable accidents.
- 24 (43%) notifiable accidents reported were caused by assembly, connection, installation and alteration. 15 (27%) were caused by design fault19 and 13 (23%) were caused by proximity to a combustion products.
- 32 (26%) notifiable accidents reported were caused by assembly, connection, installation and alteration. 37 (30%) were caused by design fault and 33 (27%) were caused by misuse.
Water heaters and boilers
- 34% (69) of the 205 notifiable accidents and 5% (32) of 612 non-notifiable accidents involved water heaters. Water heaters were involved in one fatality (in 1998) and injury to 18 people (15 injury accidents), see Graph 2i.
- In the past 25 years, 25% of the total 71 injuries involved water heaters. There have been, on average, 2.8 notifiable accidents and 1.3 non-notifiable water heater accidents per year.
- 17 (25%) notifiable accidents reported were caused by lack of maintenance and 27 (39%) caused assembly, connection, installation and alteration.
- 11 (34%) non-notifiable accidents reported were caused by lack of maintenance, 9 (28%) were caused by proximity to a combustion products and 9 (28%) caused by assembly, connection, installation and alteration.
6. Liquefied Petroleum Gas (LPG)
This section deals with notifiable and non-notifiable accidents reported to Energy Safety involving liquefied petroleum gas (LPG).
It includes LPG fuel gas-related accidents of all types, including fire and explosion, whether there were casualties or property loss. All non-notifiable accidents, except for those reported in bulk20, are included in this analysis.
This analysis examines accidents involving members of the public in 2017, and also for the 25 year period from 1993 to 2017. It includes a comparison between the base period (1993-1997) and the current five year period (2013-2017). In addition to accidents involving members of the public Energy Safety retains an interest in equipment which is reflected in this analysis.
Historically data relating to LPG accidents did not focus on the victim’s age. Recording data related to the age group of the victim for gas started with the introduction of an integrated case management system (ESI) in 2008. This section identifies general trends and examines general categories of appliances and other equipment involved in accidents.
LPG is normally used as a fuel for heating, cooking or lighting. However, in a few cases, LPG is deliberately inhaled with serious consequences. (Energy Safety is not the lead agency for investigating incidents that involve the deliberate inhalation of LPG.)
Deliberate LPG inhalation accidents differ from other LPG accidents as the fuel is knowingly misused or handled without any fault in the equipment or fuel. Analysis that included this data might give the impression that LPG is a more dangerous fuel than it actually is in normal use. Deliberate LPG inhalation accidents are not included in the LPG accident analysis.
Current trends
Examination of notifiable LPG accidents shows that during 2017:
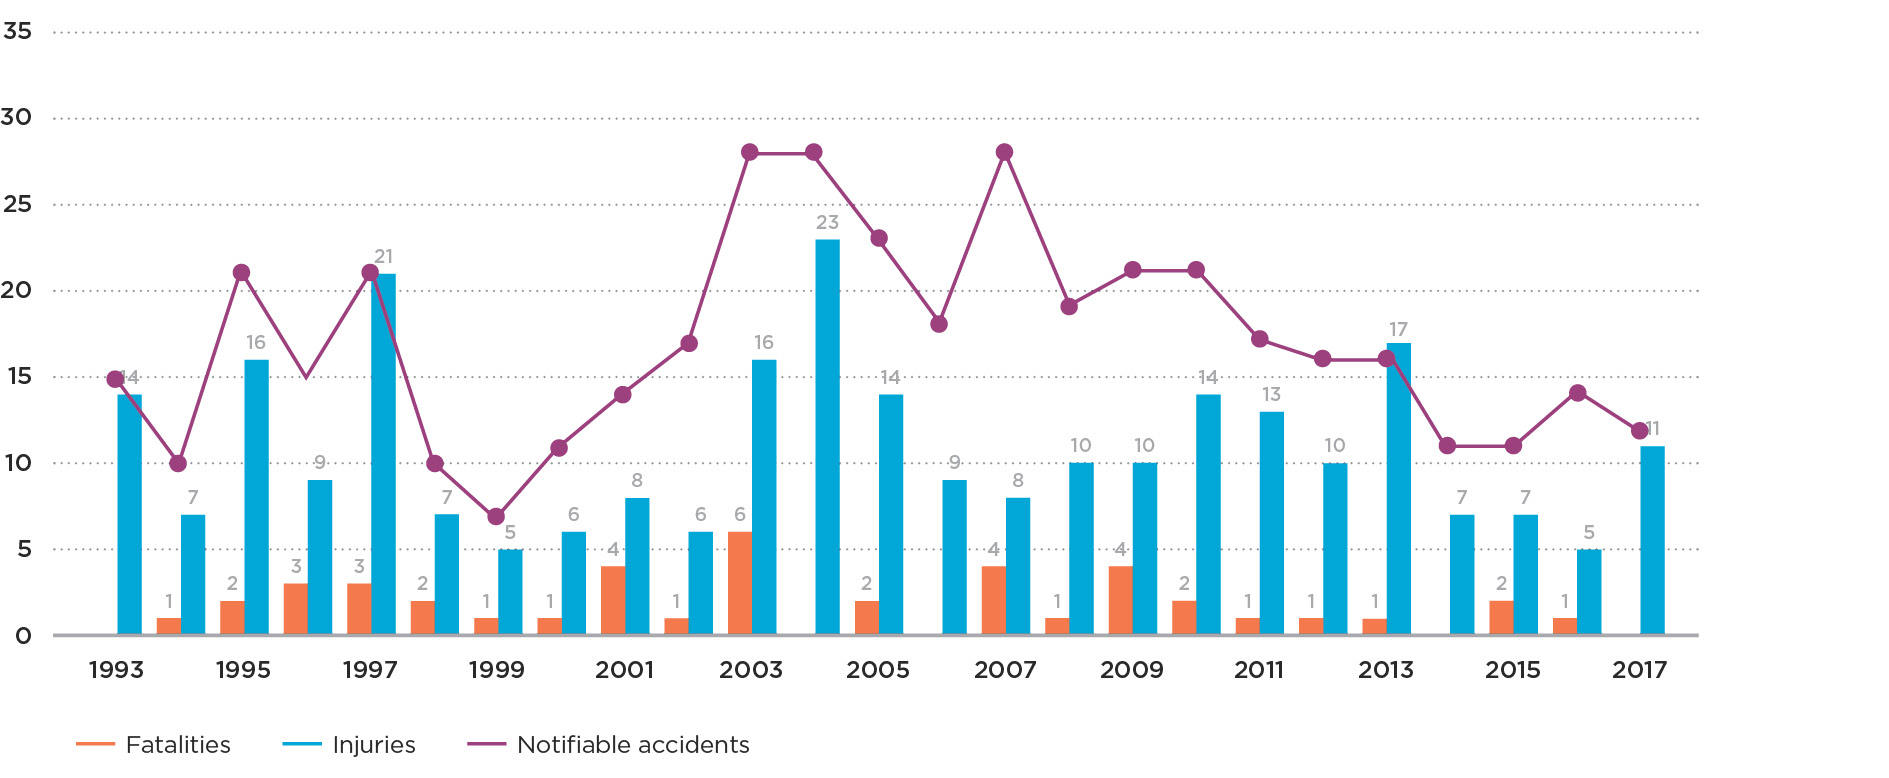
- There were 12 notifiable accidents that involved injury or significant property damage. The average annual notifiable accident number is 17.0 over the past 25 years.
- There were no fatal LPG accidents this year. Over the last 25 years the average number of fatal accidents has been 1.4 per year and 1.7 fatalities per year.
- Six of the notifiable injury accidents injured 11 people. The average for the last 25 years of 7.9 notifiable injury accidents, causing an average of 10.9 injuries.
- Cooking appliances, cabinet heaters, barbecues and gas installations are involved in the injury causing accidents.
- Cookers or ovens were involved in one third of these notifiable accidents.
- 14 non-notifiable accidents were reported to Energy Safety. This is less than two-thirds of the annual average number (22.1) over the last 25 years. All except one of these non-notifiable accidents resulted in fires.
Longer term trends
Observations based on analysis of trends, consequence and frequency for the 24 year period between 1993 and 2017:
- 36 fatal accidents resulted in 43 fatalities.
- Cooking equipment was involved in 13 (36%) fatal accidents resulting in 17 (40%) fatalities.
- Cabinet heaters were involved in 12 (33%) of fatal accidents resulting in 13 (30%) fatalities. Two of these 12 fatal accidents were within the last five years.
- A fatal accident involving fire or explosion is more frequent than a fatal accident involving carbon monoxide poisoning, but carbon monoxide poisoning is more deadly. 23 of these 43 fatalities involved fire or explosion (in 21 accidents) and 18 fatalities involved carbon monoxide poisoning in 14 cases. An average of 1.1 fatalities occurred per fire or explosion accident while an average of 1.3 fatalities occurred for carbon monoxide poisoning accidents.
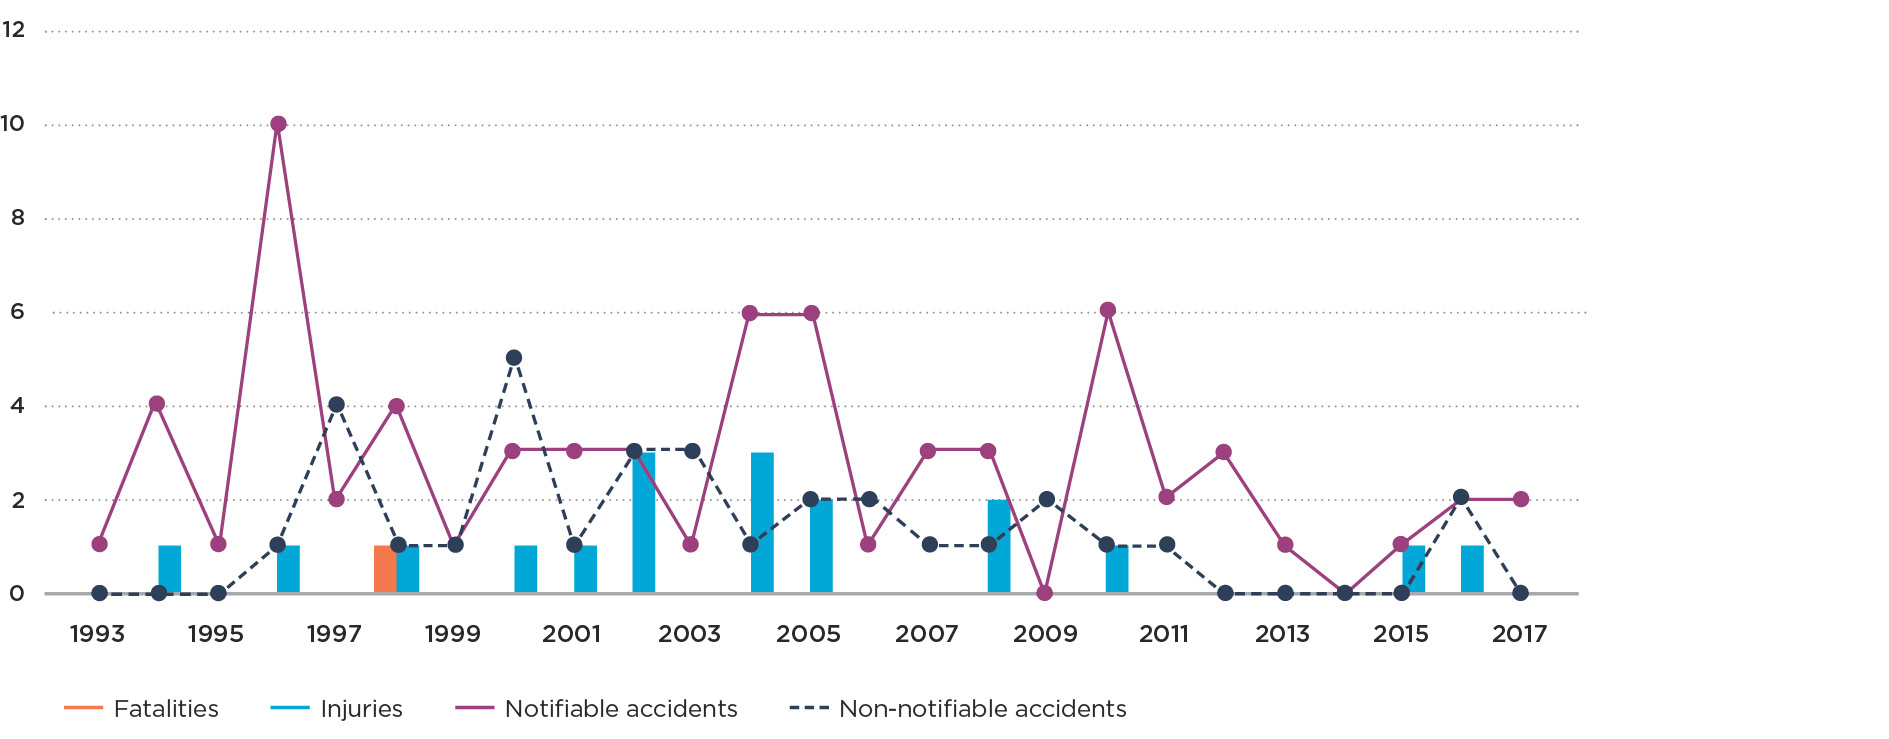
- There is no clear long term trend to indicate any change in the number of fatal accidents over the last 25 years (see Graph 3a). However, there appears to have been a spike in the number of fatal cabinet heater accidents between 2007 and 2012 compared to the long term trend. Seven of the 12 fatal accidents occurred in the six year period (2007-2012) in comparison to three fatal accidents (four fatalities) in the previous 14 years (1993-2006). There have been two fatal cabinet heater accidents since 2013 (last five years).
- There have been 424 notifiable accidents. 148 (35%) of the total notifiable accidents and 229 (41%) of the 552 non-notifiable accidents were caused by poor assembly, connection, and installation of or alteration to, an appliance. When analysing gas related accidents it is worth noting that many of these accidents may have had more than one cause attributed to them.
- A total of 197 notifiable injury accidents caused injuries to 261 people.
- Table 8 and table 9 give a more detailed breakdown of LPG casualty and all LPG accidents by equipment type. Cooking appliances were involved in 39% and cabinet heaters in 28% of injury accidents. Two thirds of injuries were caused by these two types of equipment.
- Of the total 424 notifiable accidents, 390 (92%) accidents involved mainly fires or explosions and about half (233) of these fire accidents resulted in casualties.
- A total of 552 non-notifiable accidents were reported to Energy Safety. A small reduction in non-notifiable accidents is observed over this period and a very clear downward trend is noticeable over the last 16 years (2002-2017) (see Graph 3b).
- 167 (30%) non-notifiable accidents involved cabinet heaters; 91 (17%) involved containers; 88 (16%) barbecues; and 87 (16%) cooking equipment.
- Over 71% (390) of non-notifiable accidents involved fires or explosions, and about 24% (133) involved gas escaping.
- 21% of the total 976 notifiable and non-notifiable accidents were reported by Health & Safety Inspectors, and 26% were reported by the New Zealand Fire Service (now Fire and Emergency New Zealand). However, notification by Health & Safety Inspectors has significantly reduced over the last ten years (2.7% of total notification).
- Table 10 gives the most common causes of LPG accidents over the past 25 years and the last five years. The main causes21 of the notifiable accidents (see Graph 3c) have been:
- Incorrect assembly, connection, installation or alteration (35%)
- Incorrect operation (15%)
- Lack of maintenance (16%)
- Operating close to flammable materials (8%)
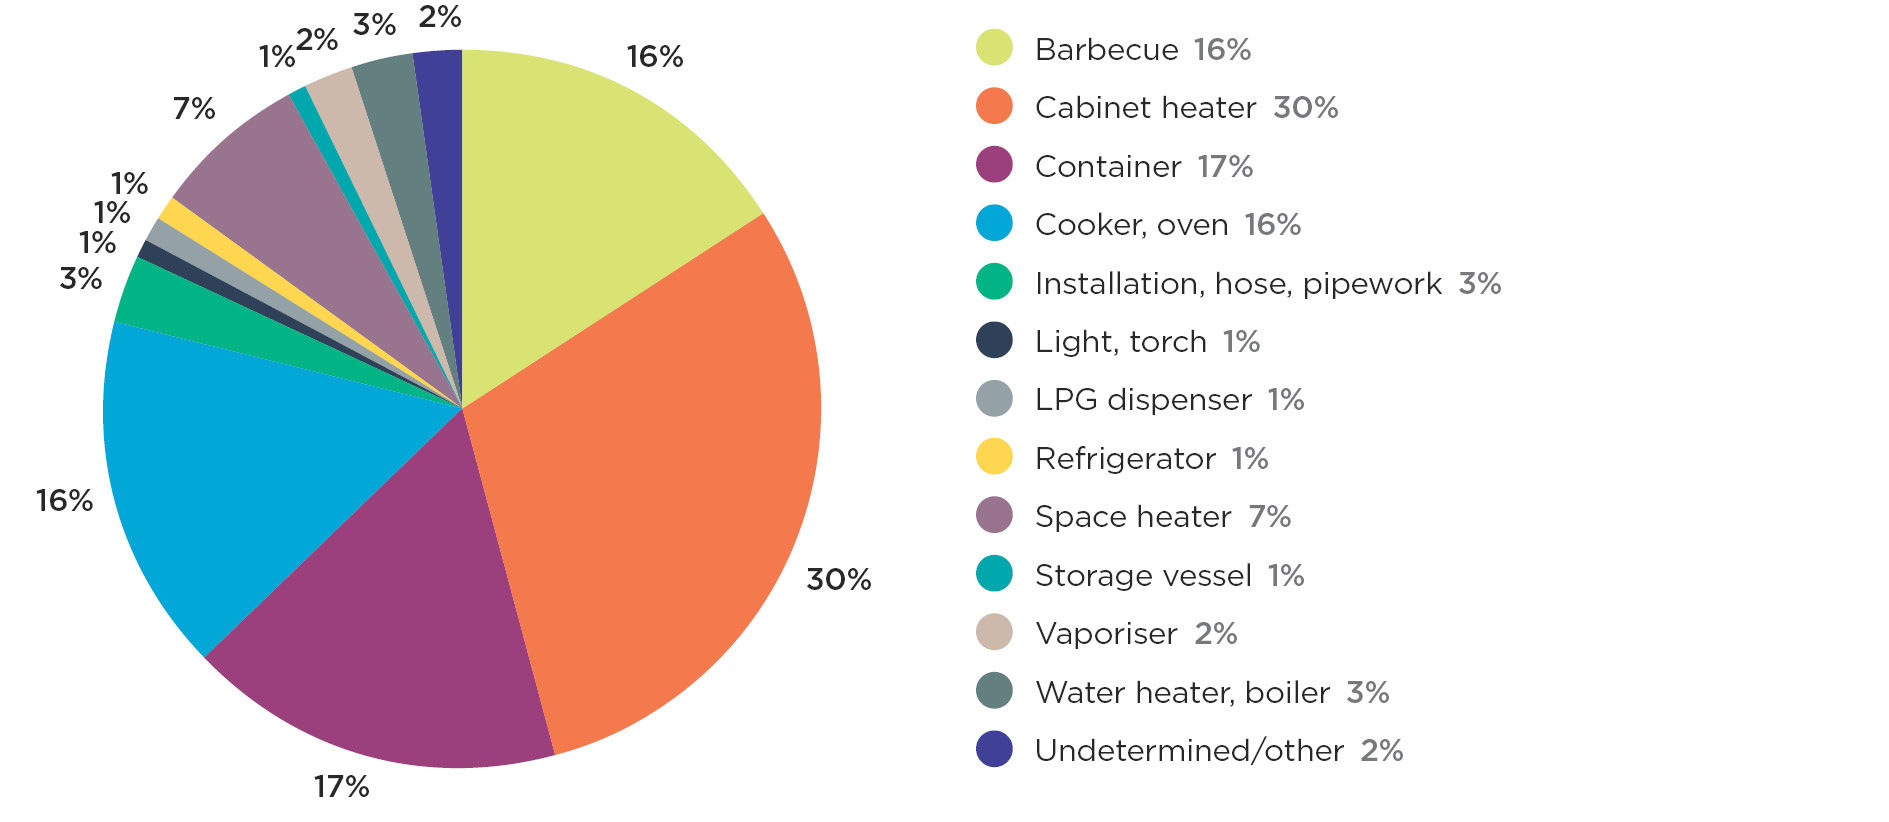
- These causes were also the major contributors to non-notifiable accidents reported to Energy Safety (see Graph 3d).
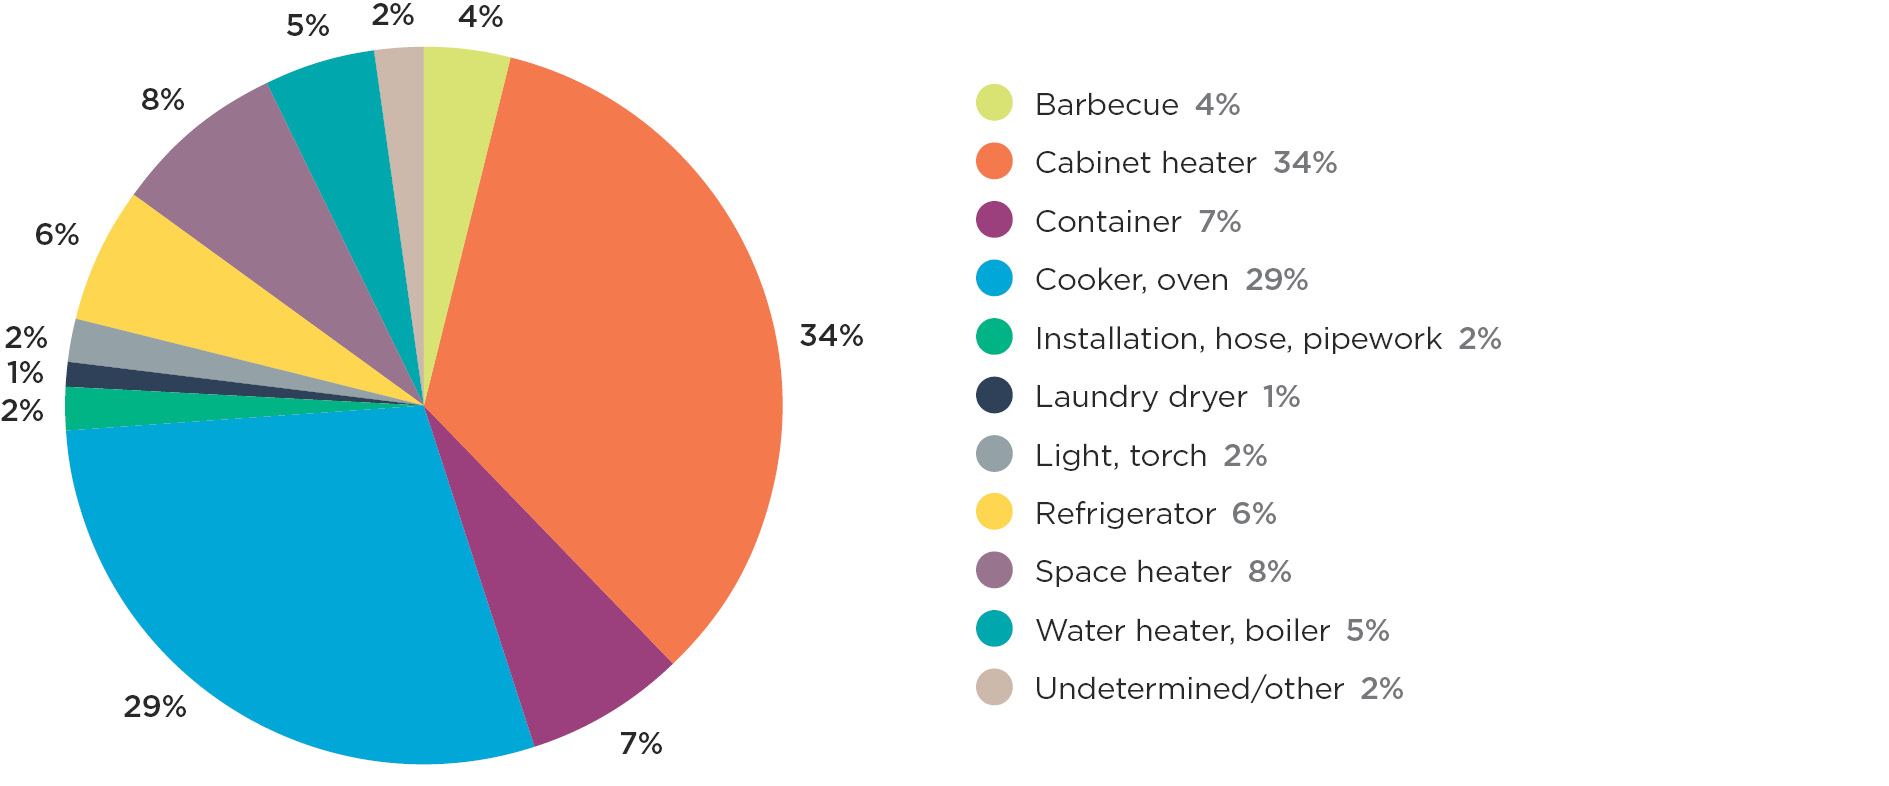
The major contributors to notifiable accidents have been:
- Cabinet heaters (34%)
- Containers (7%)
- Cookers and ovens (29%)
This equipment has also contributed to a significant level of non-notifiable accidents (see Graph 3e). Together these three types of equipment have contributed to about two thirds of the total number of non-notifiable accidents. Barbecues have contributed to 16% of non-notifiable LPG accidents, but for only about 4% of notifiable accidents (see Graph 3f).
- Gas equipment fuelled by canisters (non-refillable) was involved in 34 notifiable accidents over the last 25 years which is about 8% of the total LPG notifiable accidents.
- Three canister fuelled notifiable accidents caused six fatalities (14% of the total LPG fatalities) and 28 notifiable accidents injured 49 people (18% of total LPG injuries).
- 11% (46) of notifiable LPG accidents (424) occurred in caravans. Ten of these were fatal causing 11 fatalities. 25 of the notifiable accidents injured 39 people, 14% of total LPG injuries (see Table 11).
Equipment
Cookers and ovens
- 29% (122) of the 424 notifiable accidents and 16% (87) of the 552 non-notifiable accidents involved cookers or ovens. Cookers and ovens were involved in 17 fatalities (13 fatal accidents) and injured 116 people (77 injury accidents), see Graph 3g.
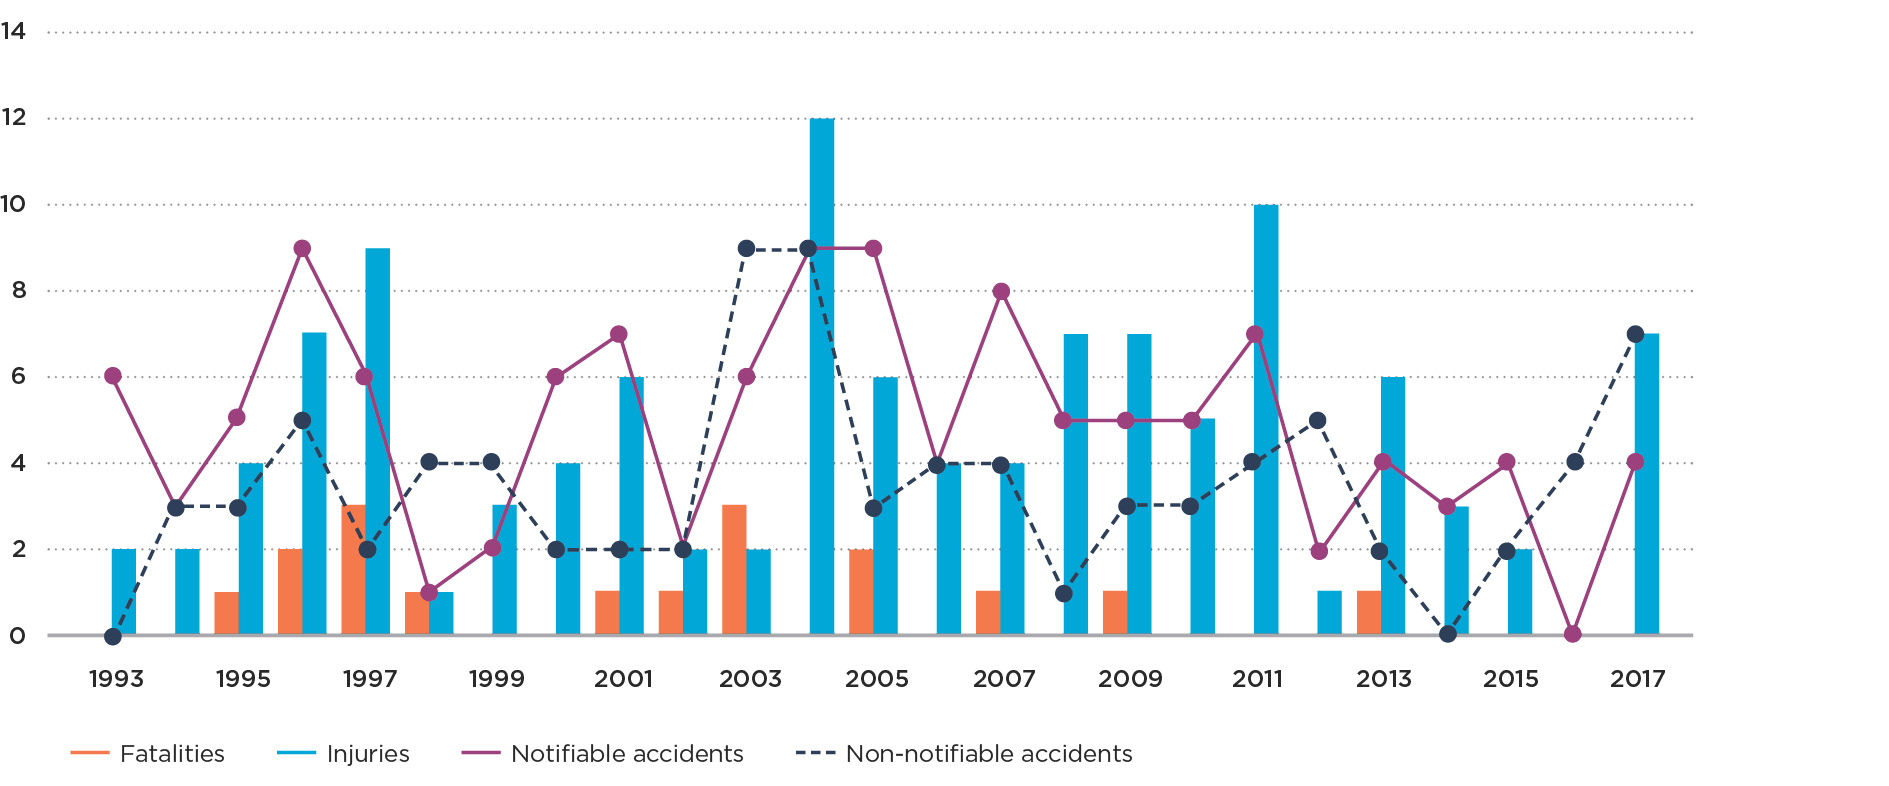
- 40% of total fatalities and 42% of total injuries involved cookers or ovens. In the past 25 years there have been 0.7 fatalities, 4.6 injuries, 4.9 notifiable accidents, and 3.5 non-notifiable accidents per year on average.
- 19 (16%) notifiable accidents reported were caused by incorrect operation and 51 (42%) caused assembly, connection, installation and alteration.
- 42 (48%) non-notifiable accidents reported were caused by assembly, connection, installation and alteration
Cabinet heaters
- 34% (143) of the 424 notifiable accidents and 30% (167) of the 552 non-notifiable accidents involved cabinet heaters. Cabinet heaters were involved in 13 fatalities (12 fatal accidents), and injury to 67 people (56 injury accidents) (see Graph 3h).
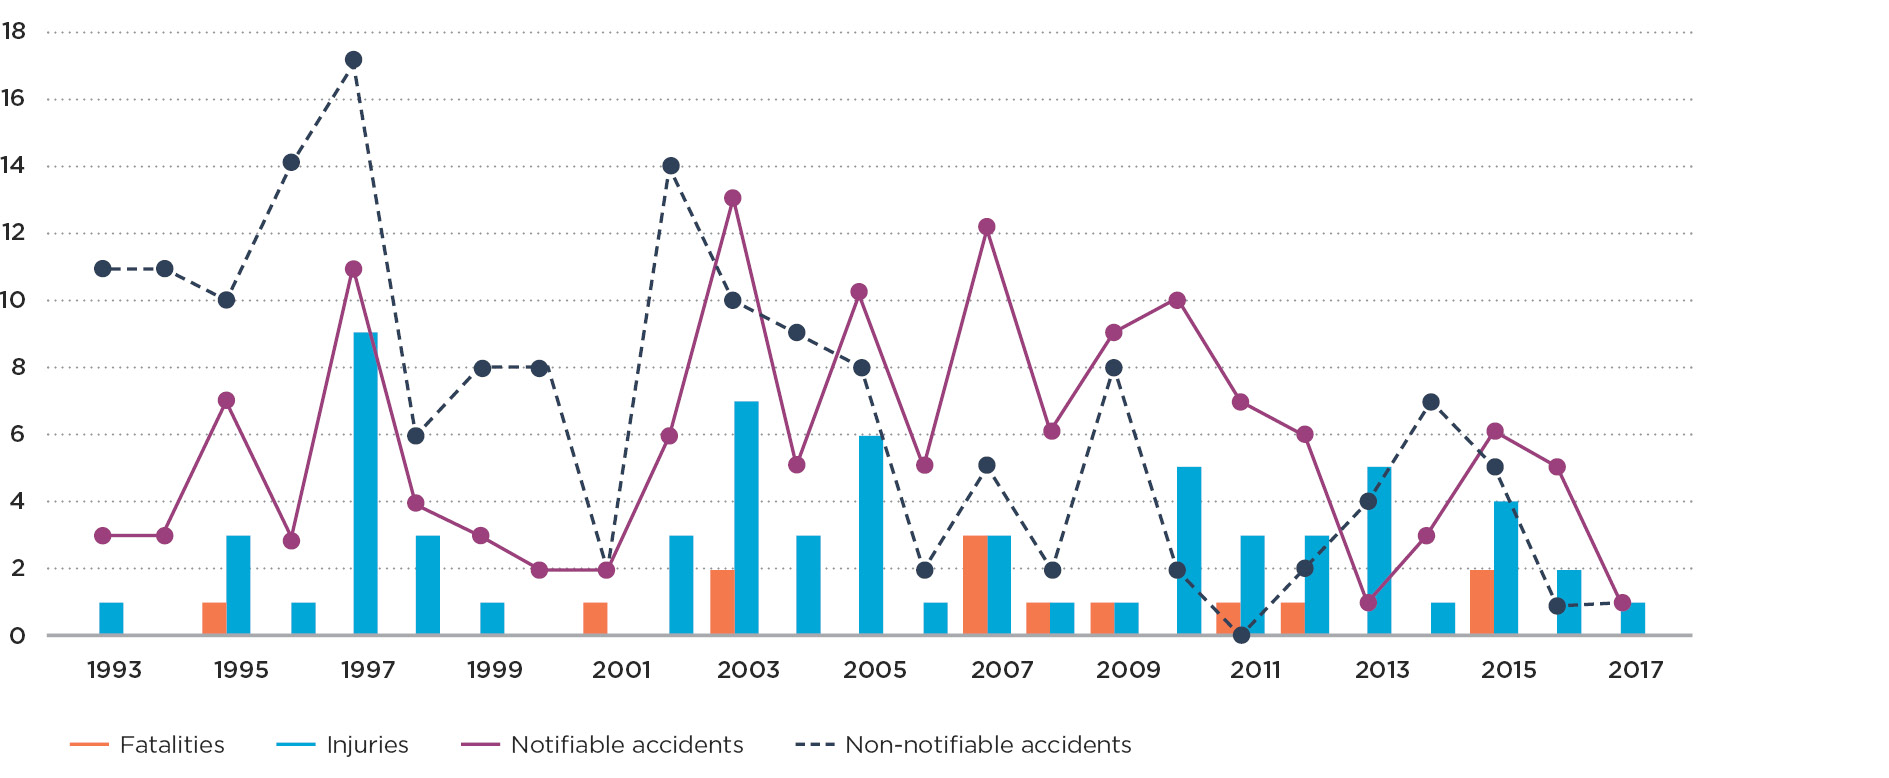
- 30% of total LPG fatalities and 25% of total injuries involved cabinet heaters. In the past 25 years there have been 0.5 fatalities, 2.7 injuries, 5.7 notifiable accidents and 6.7 non-notifiable accidents per year on average.
- 23 (16%) notifiable accidents reported were caused by lack of maintenance, 13 (16%) were caused by proximity to a combustion products and 39 (27%) caused assembly, connection, installation and alteration.
- 26 (16%) non-notifiable accidents reported were caused by lack of maintenance and 88 (53%) caused by assembly, connection, installation and alteration.
Barbecues
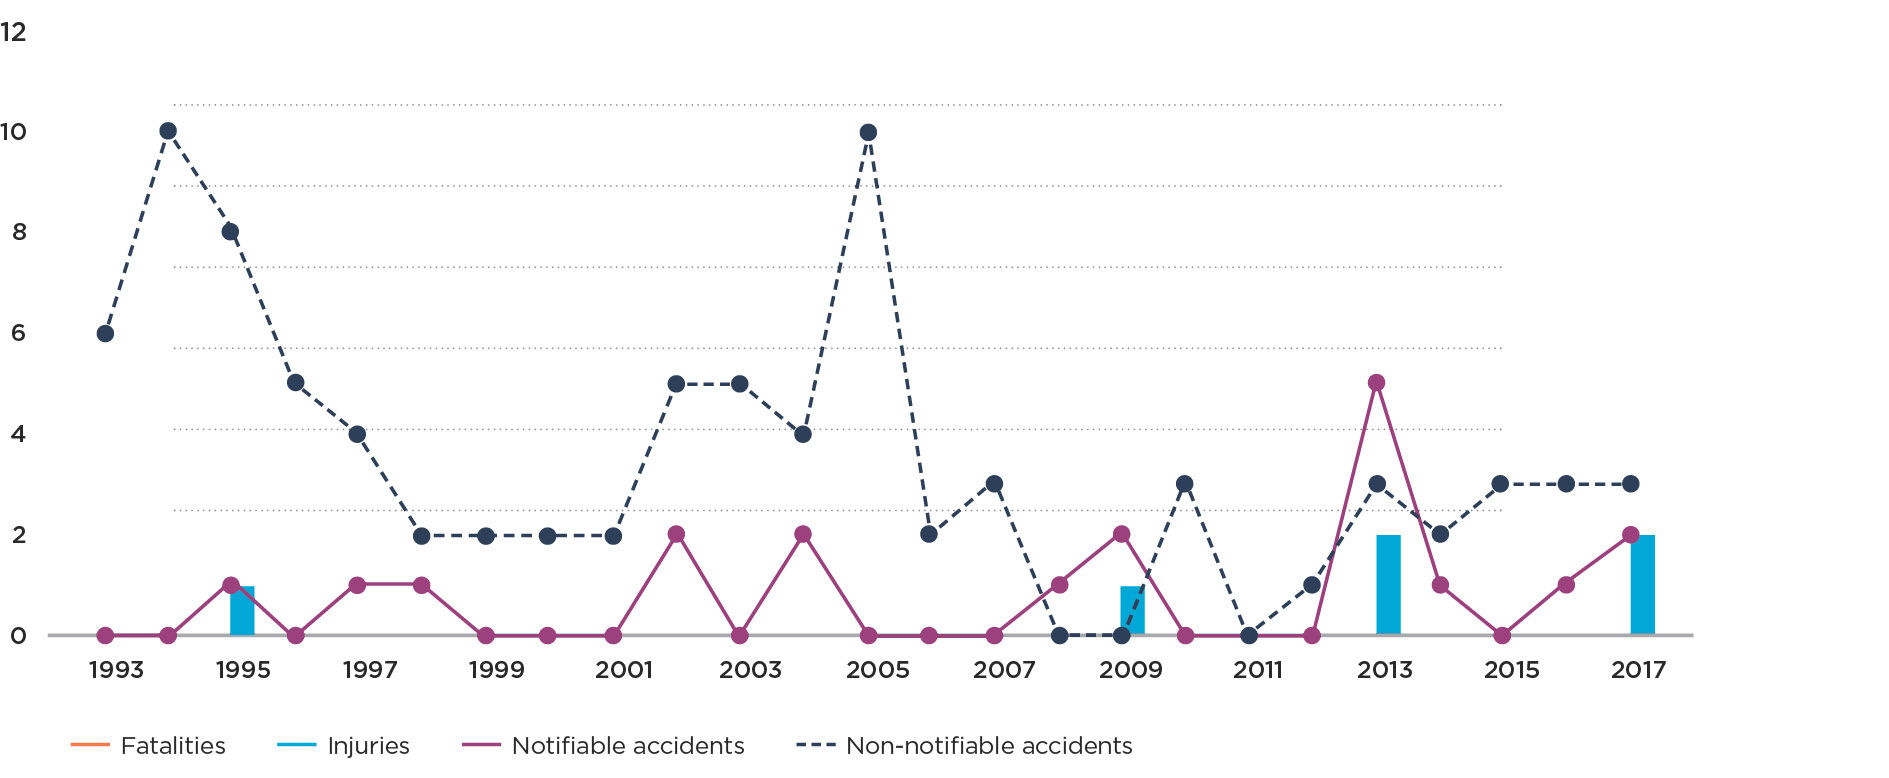
- 4% (19) of the 424 notifiable accidents and 16% (88) of the 552 non-notifiable accidents involved barbecues. Barbecues were not involved in any fatalities, but injured six people (five injury accidents), see Graph 3i.
- In the past 25 years there have been 0.8 notifiable accidents and 3.5 non-notifiable accidents per year on average.
- 6 (32%) notifiable accidents and 53 (60%) of non-notifiable accidents reported were caused by assembly, connection, installation and alteration.
Environment
Caravans and campervans
- 11% (46) of the 424 notifiable accidents and 3% (17) of the 552 non-notifiable accidents occurred in caravans or campervans. Caravans and campervans were involved in 11 fatalities (10 fatal accidents) and injured 39 people (25 injury accidents) (see Graph 3j).
- 26% of total fatalities and 14% of total injuries occurred in caravans or campervans. In the past 25 years there have been 0.4 fatalities, 1.6 injuries, 1.8 notifiable accidents and 0.7 non-notifiable accidents per year on average.
- 22 (48%) notifiable accidents and 4 (24%) of non-notifiable accidents reported were caused by assembly, connection, installation and alteration.
|
Fatal Consequence22 |
Injury Consequence | |||
|---|---|---|---|---|
| Equipment type |
1993-2017 |
2013-2017 |
1993-2017 |
2013-2017 |
| Cookers & ovens | 17 (13) | 1 (1) | 116 (77) | 18 (11) |
| Cabinet heaters | 13 (12) | 2 (2) | 67 (55) | 13 (10) |
| BBQ | 0 (0) | 0 (0) | 6 (5) | 4 (3) |
| Refrigerator | 6 (5) | 1 (1) | 12 (10) | 5 (3) |
| Containers (refillable) | 4 (4) | 0 (0) | 19 (13) | 2 (2) |
|
Canister and |
6 (3) | 0 (0) | 49 (28) | 12 (7) |
| Total | 43 (36) | 4 (4) | 273 (197) | 47 (34) |
Table 8: Breakdown of LPG casualty accidents involving members of the public by equipment type
|
Notifiable Accidents23 |
Non-notifiable Accidents | |||
|---|---|---|---|---|
| Equipment type |
1993-2017 |
2013-2017 |
2013-2017 |
2013-2017 |
| Cookers & ovens | 122 (4.9) | 15 (3.0) | 87 (3.5) | 16 (3.2) |
| Cabinet heaters | 143 (4.7) | 16 (3.2) | 167 (6.7) | 18 (3.6) |
| BBQ | 19 (0.8) | 9 (1.8) | 88 (3.5) | 14 (2.8) |
| Refrigerator | 26 (1.0) | 8 (1.6) | 6 (0.2) | 0 (0) |
| Containers (refillable) | 26 (1.0) | 2 (0.4) | 88 (3.5) | 0 (0) |
|
Canister and |
34 (1.4) | 8 (1.6) | 18 (0.7) | 5 (1.0) |
| Total | 424 (17.0) | 63 (12.6) | 552 (22.1) | 67 (13.4) |
Table 9: Breakdown of LPG accidents involving members of the public by equipment type
|
Period |
Period | |
|---|---|---|
| Main causes |
Assembly, connection, installation, alteration – 35% Operation error – 15% Lack of maintenance – 16% Design – 7% Procedure – 9% Carelessness – 9% |
Assembly, connection, installation, alteration – 18% Operation error – 5% Lack of maintenance – 11% Design – 13% Procedure – 21% Carelessness – 21% |
Table 10: Factors in notifiable LPG accidents involving members of the public
| Environment |
Consequence24 |
Consequence |
|---|---|---|
| Caravan or campervan |
Fatal 11 (10) Injury 39 (25) Notifiable (46) Non-notifiable (17) |
Fatal 0 (0) Injury 5 (4) Notifiable (8) Non-notifiable (6) |
Table 11: Environment factors in LPG accidents involving members of the public
Appendix - Accidents and accident notification definitions
The occupier or the person in charge of a non-work related accident area is required by law to report to WorkSafe New Zealand any accidents that are caused by electricity or gas that result in fatalities, serious injuries or significant damage to property.
A “notifiable electrical accident” has the same meaning as a “notifiable accident” in the Electricity Act 1992. A “notifiable electrical accident” is defined as an accident that:
- is caused wholly or partly by, or involves or affects, electricity, or involves or affects the generation, conversion, transformation, conveyance, or use of electricity; and
- results in –
- serious harm to any person; or
- damage to any place or part of a place that renders that place or that part of that place unusable for any purpose for which it was used or designed to be used before that accident.
Serious harm means:
- death; or
- injury that consists of or includes loss of consciousness; or
- injury that necessitates the person suffering the injury –
- being admitted to hospital; or
- a notifiable injury or illness as defined in section 23 of the Health and Safety at Work Act 2015 (previously it was receiving medical treatment from a medical practitioner).
A “notifiable gas accident” has the same meaning as a “notifiable accident” in the Gas Act 1992. A “notifiable gas accident” is defined as an accident that:
- involves the production, conversion, supply, distribution, or use of gas; and
- results in –
- serious harm to any person; or
- significant property damage.
Serious harm means:
- death; or
- harm that incapacitates, or is likely to incapacitate, the person suffering harm for 48 hours or more; or
- harm that incapacitates, or is likely to incapacitate, the person suffering harm due to the inhalation of carbon monoxide; or
- a notifiable injury or illness as defined in section 23 of the Health and Safety at Work Act 2015 (previously it was “harm of the kinds and descriptions that are serious harm under the Health and Safety in Employment Act 1992”).
A “non-notifiable gas accident” is defined as an accident that:
- causes property loss; and/or
- causes injury below the threshold defined in the Gas Act 1992, and is involved with what is supposed to be a safe supply or use of fuel gas.
Footnotes
[1] See section 17 of the Gas Act 1992(external link) and section 16 of the Electricity Act 1992(external link).
[2] These electrical accidents relate to direct contact with electricity – i.e. ‘shock’.
[3] Because modern reticulated gases do not contain carbon monoxide, this typically involves exposure to harmful products of combustion.
[4] For the purposes of analysis, severity is categorised broadly as ‘fatal’, ‘notifiable – injury’, 'notifiable – other’, or ‘non-notifiable’.
[5] The definition change from “receiving medical treatment from a registered health practitioner” to “admitted to hospital for immediate treatment”.
[6] The first number represents casualties and the bracketed number represents accidents.
[7] The first number represents casualties and the bracketed number represents accidents.
[8] Domestic installation fittings include switches, plugs and light fittings.
[9] For a certain period in the 1990s Energy Safety received information (notification) of third party strikes in bulk. While all were recorded, in general Energy Safety did not investigate these ‘bulk reported’ and other low level incident events.
[10] This category includes cookers, ovens and other cooking appliances.
[11] Distribution includes mains, services and regulator stations.
[12] The main reason for this drop is the change of responsibility for reporting and investigating workplace accidents.
[13] Many accidents may have had more than one cause attributed to them.
[14] Incorrect work includes assembly, connection, installation and alteration.
[15] Incorrect work includes incorrect assembly, connection, installation and alteration.
[16] The first number represents casualties and the bracketed number represents accidents.
[17] The first number represents accidents and the bracketed number represents accidents per year.
[18] This includes mains, services, regulator stations and meters.
[19] This includes engineering problems with structure/material specifications or plans. Also clear ergonomic problems (making misuse or operation error likely).
[20] For a certain period in the 1990s Energy Safety received information (notification) of minor incidents in bulk. While all were recorded, in general Energy Safety did not investigate these ‘bulk reported’ and other low level incident events.
[21] Many accidents may have had more than one cause attributed to them.
[22] The first number represents casualties and the bracketed number represents accidents.
[23] The first number represents accidents and the bracketed number represents accidents per year.
[24] The first number represents casualties and the bracketed number represents accidents.
Last updated